Reading Momentum through Candlesticks
Day traders thrive on real-time momentum – the rapid shifts in buying or selling pressure that drive intraday price moves. Candlestick charts offer a simple yet powerful window into this momentum. Each candlestick encapsulates open, high, low, and close for a period, visually depicting the tug-of-war between bulls and bears. The shape and color of the candles reveal market sentiment, helping traders gauge when momentum is building or fading.
candles with minimal wicks (marubozus) indicate decisive moves (strong momentum), whereas candles with long wicks (e.g. dojis, hammers) show hesitation or potential reversal points. By learning a few key candlestick patterns – such as engulfing patterns, hammers, dojis, inside bars, and marubozus – traders can quickly spot intraday trend reversals or continuations without relying on lagging indicators.
This article will explain how to detect momentum shifts within a single trading day using only candlestick patterns. We’ll focus on practical, simple methods suitable for retail traders with basic to intermediate experience. Each pattern is discussed in context: how to identify it, what it signals about momentum, when it works best, and how to avoid false signals. Chart examples from U.S. equity markets (e.g. S&P 500 stocks and ETFs) on intraday timeframes (1-min, 5-min, 15-min) will illustrate these concepts in action. Finally, we’ll cover some quick risk management tips for trading candlestick-based momentum signals intraday. Let’s dive into the patterns and the stories they tell about price momentum.
Candlestick Patterns as Real-Time Momentum Indicators
Candlestick patterns form through recurrent arrangements of one or more candles, and they offer instant insight into shifts in supply-demand balance. Unlike simple price quotes or line charts, candlesticks vividly show who’s in control – buyers or sellers – during each interval. A series of bullish (green) candles with expanding bodies reflects rising momentum, whereas certain distinct configurations warn that momentum is stalling or reversing. Traders around the world recognize these classic patterns, creating a common language of market sentiment.
Below, we explore some of the most useful candlestick formations for spotting intraday momentum reversals and continuations.
Engulfing Patterns: Reversal Momentum Signals
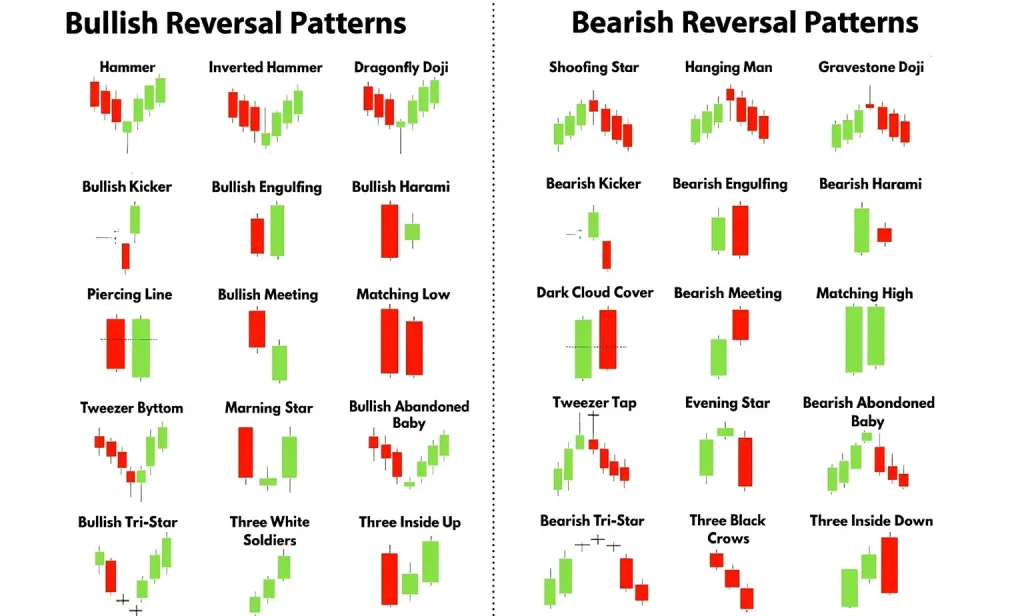
Bullish and bearish engulfing patterns are two-candle reversal signals that often mark a sudden momentum shift. A bullish engulfing pattern occurs when a down candle (red body) is followed by a large up candle (green body) that completely engulfs the prior candle’s range. This indicates that buyers have overwhelmed sellers, reversing downward momentum into an upward push.
Conversely, a bearish engulfing pattern is a large red candle engulfing the previous green candle, signaling sellers seizing control and downward momentum emerging.
Engulfing patterns essentially shout that sentiment has flipped: the prevailing intraday trend may be ending as the opposite side (bulls or bears) launches a strong counter-move.
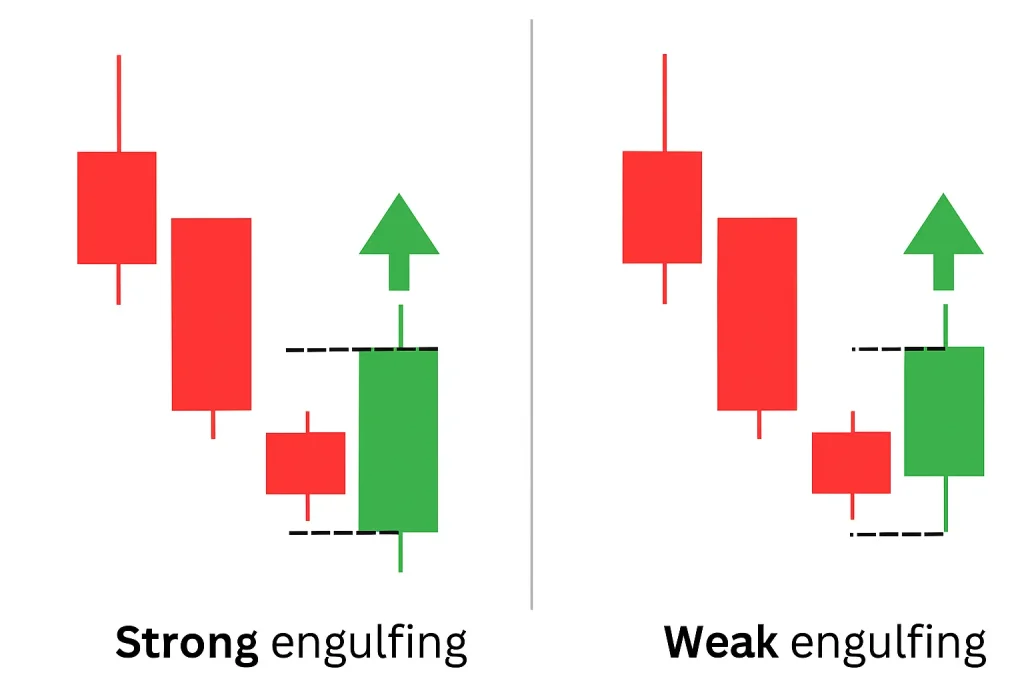
A bullish engulfing pattern on chart shows a large green candle engulfing a small red one, signaling upward momentum. Traders often enter long after confirmation, placing a stop-loss below the pattern’s low. These patterns work best after a clear trend or near support, as seen in PLUG’s midday reversal and rally. However, not all engulfings lead to big moves—context matters. They’re most effective after extended trends, less so in choppy markets. Large candles may require wide stops, so evaluate risk-reward carefully. Always plan exits in advance, as candlesticks alone don’t offer targets.
Hammer and Shooting Star: One-Candle Reversals
Single-candle patterns like the hammer and its bearish counterpart, the shooting star, are classic signals of intraday momentum shifts. A hammer forms when price sells off but rebounds within the same bar, closing near or above the open. It has a small body near the top and a long lower wick, indicating sellers lost control and buyers pushed the price back up. Hammers often appear after sharp intraday downtrends or near support, acting as bullish reversal signals.
Example: On PLUG’s 5-minute chart, a hammer with a long lower wick and small green body marked the end of a decline, leading to an uptrend. Traders typically wait for confirmation by entering if the next candle breaks above the hammer’s high, with a stop loss below the wick. Hammers work best after extended drops or at support, and volume strengthens the signal.
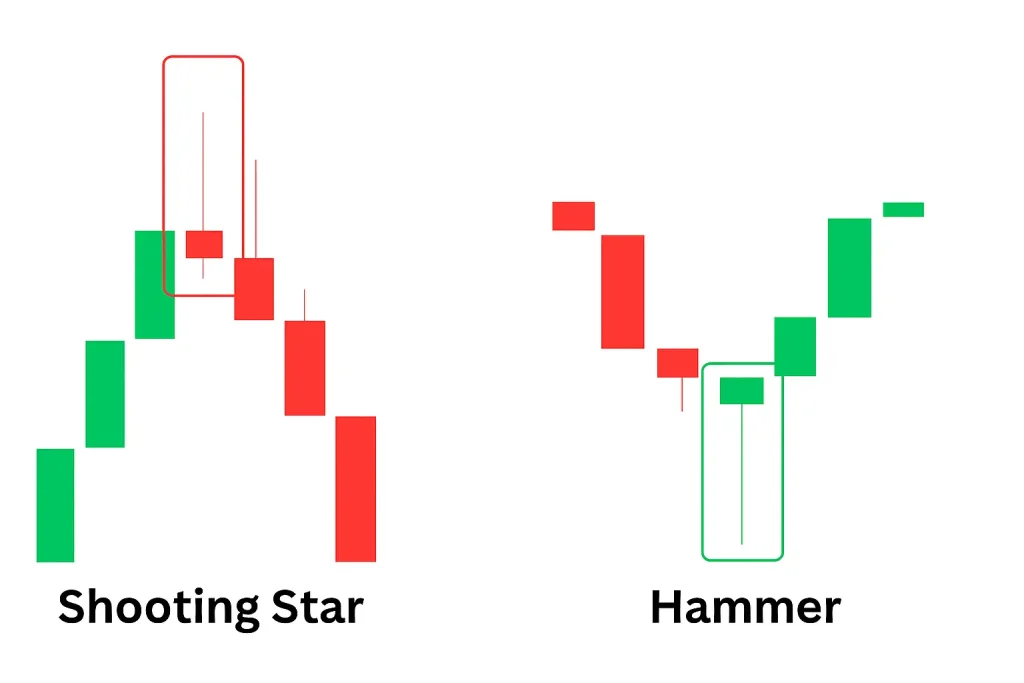
The shooting star and hanging man are bearish counterparts. A shooting star has a small body near the bottom and a long upper wick, showing buying was overtaken by selling. It often signals reversals at intraday highs or resistance. Traders may short after confirmation with a stop above the high.
Risk management is key: avoid acting without confirmation. Long wicks alone don’t guarantee reversals, especially against strong trends. Used correctly, these patterns help traders catch precise momentum reversals.
Doji Candles: Indecision Before the Break
A doji is a candlestick pattern where the open and close prices are virtually equal (the body is extremely thin or absent), often with wicks on both ends. It represents temporary market equilibrium – a tug-of-war ending in a tie. Neither bulls nor bears dominate, resulting in an indecision candle. Intraday, dojis often appear during consolidations or trend pauses. Their importance lies in what follows: a momentum shift or continuation, depending on who breaks the stalemate.
Example: A morning doji on intraday chart showed a tiny body at the top and long lower wick after a downtrend. When price broke upward, it confirmed momentum had shifted to the bulls. Likewise, a gravestone doji (long upper wick, close near low) atop a rally signals weakening buying; a following down candle suggests bearish momentum. Traders treat dojis as pivot points and wait for confirmation. A common approach is to enter on a break of the doji’s range—buy above for bullish bias, sell below for bearish—with stops on the opposite side. This trades the resolution of prior indecision.
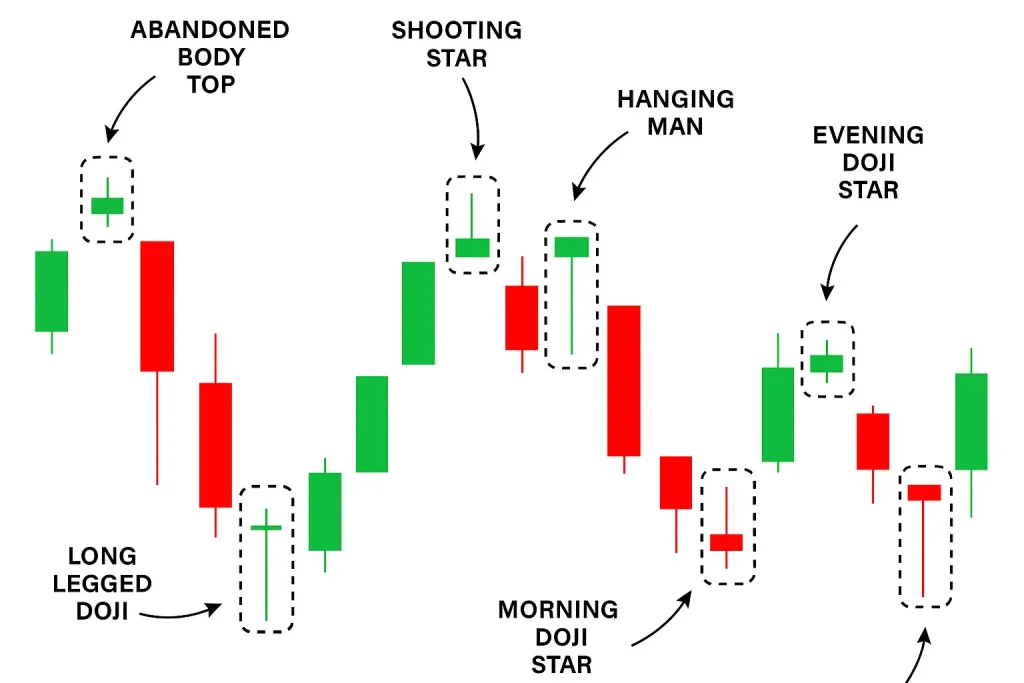
Not all dojis signal reversals—many simply reflect pauses, especially in strong trends. Context matters: multiple dojis in a tight range suggest consolidation before a breakout, while a lone doji after a sharp move may hint at reversal. Combine dojis with volume and support/resistance clues. Above all, be patient—dojis mark a market at a crossroads. The next break beyond its high or low reveals the new momentum direction.
Inside Bars: Consolidation and Breakout Momentum
An inside bar pattern is a two-candle formation where the second candle’s range is fully within the previous candle’s range (the “mother bar”). It signals brief consolidation or a pause in price action, often seen during midday lulls or after initial bursts of activity. Inside bars typically precede momentum breakouts once price moves beyond the mother bar’s range.
Traders see inside bars as a buildup of tension between bulls and bears. A break above or below the inside bar indicates that tension is resolving. These breakouts usually follow the prevailing trend—uptrend breakouts suggest continuation rallies, while downtrend breakouts point to further declines. Occasionally, inside bars may signal reversals, especially after extended trends, but they more often indicate continuation. This reliability makes them popular for breakout setups.
Trading inside bars is simple: place buy stops above the high or sell stops below the low. Stops are placed on the opposite side to limit risk. It’s best to wait for a clear break or close outside the mother bar to avoid false signals. Avoid trading very small or clustered inside bars, which may reflect choppy, low-volatility conditions. The cleanest moves usually follow a single inside bar after a strong mother bar.
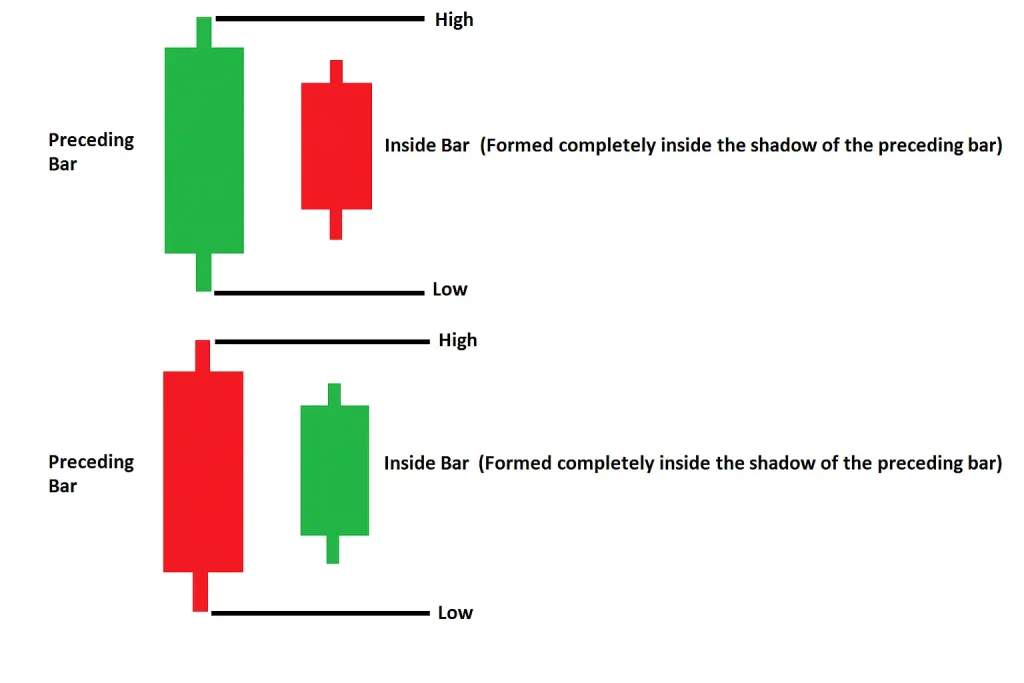
Inside bars are more reliable in strong trending markets as pauses before continuation. In sideways or low-volume environments, breakouts may lack follow-through. On very short timeframes, inside bars appear frequently due to noise, so 5- or 15-minute charts are more effective. Overall, inside bars offer intraday traders a structured way to catch momentum bursts from consolidation, with clear entries and stops.
Marubozu Candles: Full-Throttle Momentum
A candlestick with no wicks (or almost none) is a Marubozu – a Japanese term meaning “close-cropped.” It’s a single candle where the open is at one extreme and the close at the other, forming a full-bodied bar. A bullish marubozu opens at the low and closes at the high (long green bar), while a bearish one opens high and closes low (long red bar). This pattern reflects strong momentum, showing one side dominated the session without significant pullbacks.
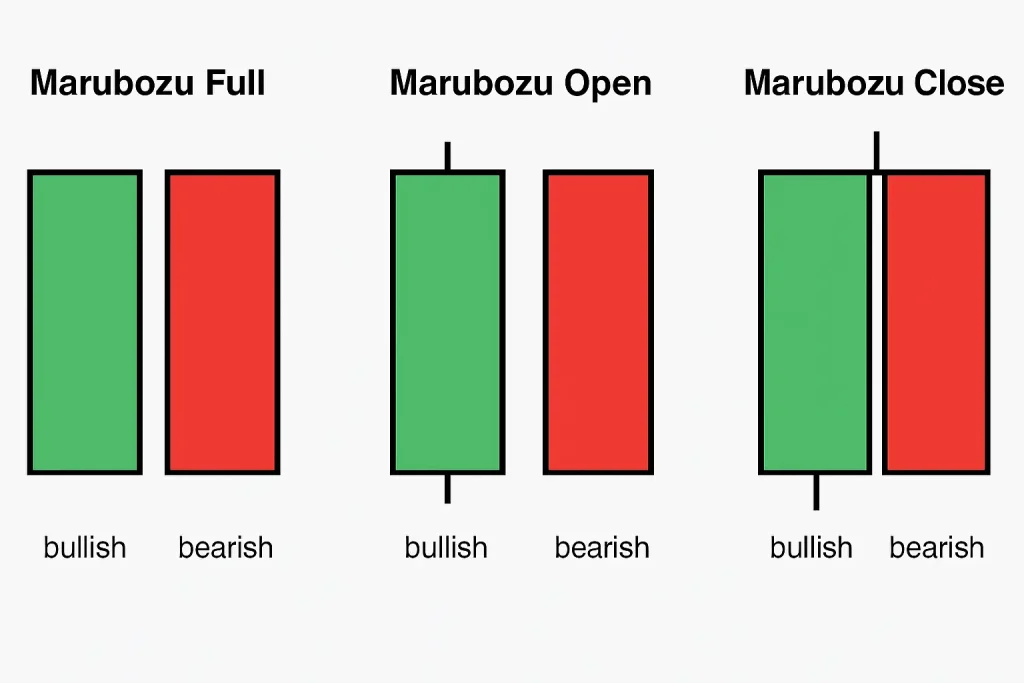
For intraday traders, marubozus often appear on breakouts or breakdowns, especially in response to news. For instance, when a stock breaks resistance after several tries, a marubozu may signal aggressive buying and trend continuation. In an uptrend, a bullish marubozu confirms buyer strength. Traders may enter near the close or treat the candle as confirmation of a breakout, placing stops just below its mid-point or low.
However, very large marubozus can signal exhaustion—possibly a climax after a long trend. A big bearish marubozu at the end of a downtrend may precede a bounce, while a huge bullish one could mark a blow-off top. Context and follow-through are key: if price fails to continue after a marubozu at support/resistance, it might be a final push before reversal.
Risk-wise, marubozus are tricky. Their size often means wide stops and less favorable risk/reward. A better entry may come after a minor pullback. Alternatively, use a half-size position and add if the move confirms. Despite these caveats, marubozus are valuable momentum indicators. They clearly show which side is in control and can confirm trends or breakouts—just watch for the rare case where they signal the trend’s final burst.
Risk Management and Avoiding False Signals
Candlestick patterns are powerful real-time signals, but no pattern is foolproof. Intraday markets can be volatile and prone to head-fakes, so it’s essential to manage risk and filter out weak signals. Here are practical tips for using candlestick momentum signals wisely:
• Trade in Context: Always assess candlestick patterns within the broader trend and key price levels. A pattern at known support or resistance carries more weight—e.g., a hammer at intraday support is more credible than one mid-range. Continuation patterns are also more reliable when they form in strong trends rather than flat markets.
• Wait for Confirmation: One candle can be misleading. When possible, wait for the next candle to confirm the signal—like closing above a hammer’s high or below a shooting star’s low. This helps avoid reacting to false signals.
• Use Stop Losses Strategically: Candlestick setups provide natural stop levels, usually just beyond the pattern. If price moves past a pattern’s extreme in the opposite direction, it’s invalidated. Always use a stop, and size your positions so a loss is manageable. Never trade intraday without one.
• Beware of Choppy Periods: Midday sessions often produce false patterns due to low volume. Signals during these quiet times are less trustworthy. Candlestick patterns work best during active market hours like the morning open or final hour.
• Volume as a Filter: Volume confirms momentum. A bullish pattern with strong volume is more convincing than one on low volume. For instance, a doji or inside bar breaking out on a volume surge likely reflects real momentum. If volume is weak, consider waiting or skipping the trade.
• Take Profits Systematically: Since candlesticks don’t provide profit targets, define your exit strategy ahead of time—such as targeting the next resistance, using measured moves, or trailing a stop. This avoids letting winners turn into losers on a sudden reversal.
• Practice and Refine: Pattern recognition improves with practice. Study charts or use simulators to develop your eye. With time, you’ll learn which setups work best. Some traders combine candlestick patterns with indicators or higher timeframes for added confirmation. While this guide focuses on candlesticks alone, it’s okay to integrate them into your broader strategy—as long as price action remains your foundation.
By adhering to these guidelines, you can capitalize on candlestick momentum signals while keeping your downside in check. Remember that trading is a probability game: even a high-probability candlestick setup won’t work every time. But with strict risk management (stops, position sizing) and careful selection of only the best, most context-supported patterns, you tilt the odds in your favor.
Conclusion
Candlestick patterns distill the market’s intentions into easy-to-read visual cues, making them ideal for spotting intraday momentum shifts. Whether it’s a bullish engulfing igniting a reversal, a hammer marking capitulation and bounce, a doji signaling a turning point, an inside bar coiling up for a breakout, or a marubozu baring strong trend conviction, these patterns allow traders to interpret and act on price action in real time. We’ve seen how each formation provides clues about the balance of power between buyers and sellers, helping anticipate trend reversals or continuations within the same day.
For retail traders and day traders, mastering a handful of these candlestick signals can greatly enhance timing and confidence in trade decisions. The methods discussed here deliberately avoid complexity – focusing on raw price patterns – because simplicity often works best in the fast-paced intraday environment. That said, success comes from practice and prudence: always consider the broader context, watch out for false signals, and use sound risk management on every trade. A candlestick pattern is an invitation, not a guarantee – it invites you to observe that momentum may be shifting, but it’s your job to confirm and manage the trade thereafter.
In summary, candlestick patterns offer an accessible, analytical yet intuitive approach to reading the market’s minute-by-minute story. They empower traders to make quick decisions based on the market’s own language. By incorporating the techniques and precautions outlined above, you can start spotting real-time momentum on your charts with greater accuracy. As momentum builds or fades with each candlestick, you’ll be prepared to ride the new trend or step aside safely. Happy trading, and may your candlestick insights lead you to timely entries, smooth trend rides, and well-managed exits in the dynamic world of intraday trading.


