Skip to content
Home
Market Analysis
Blog
Home
Market Analysis
Blog
SPY Technical Analysis - September 11, 2025
Key Indicators, Support & Resistance, and Daily Outlook
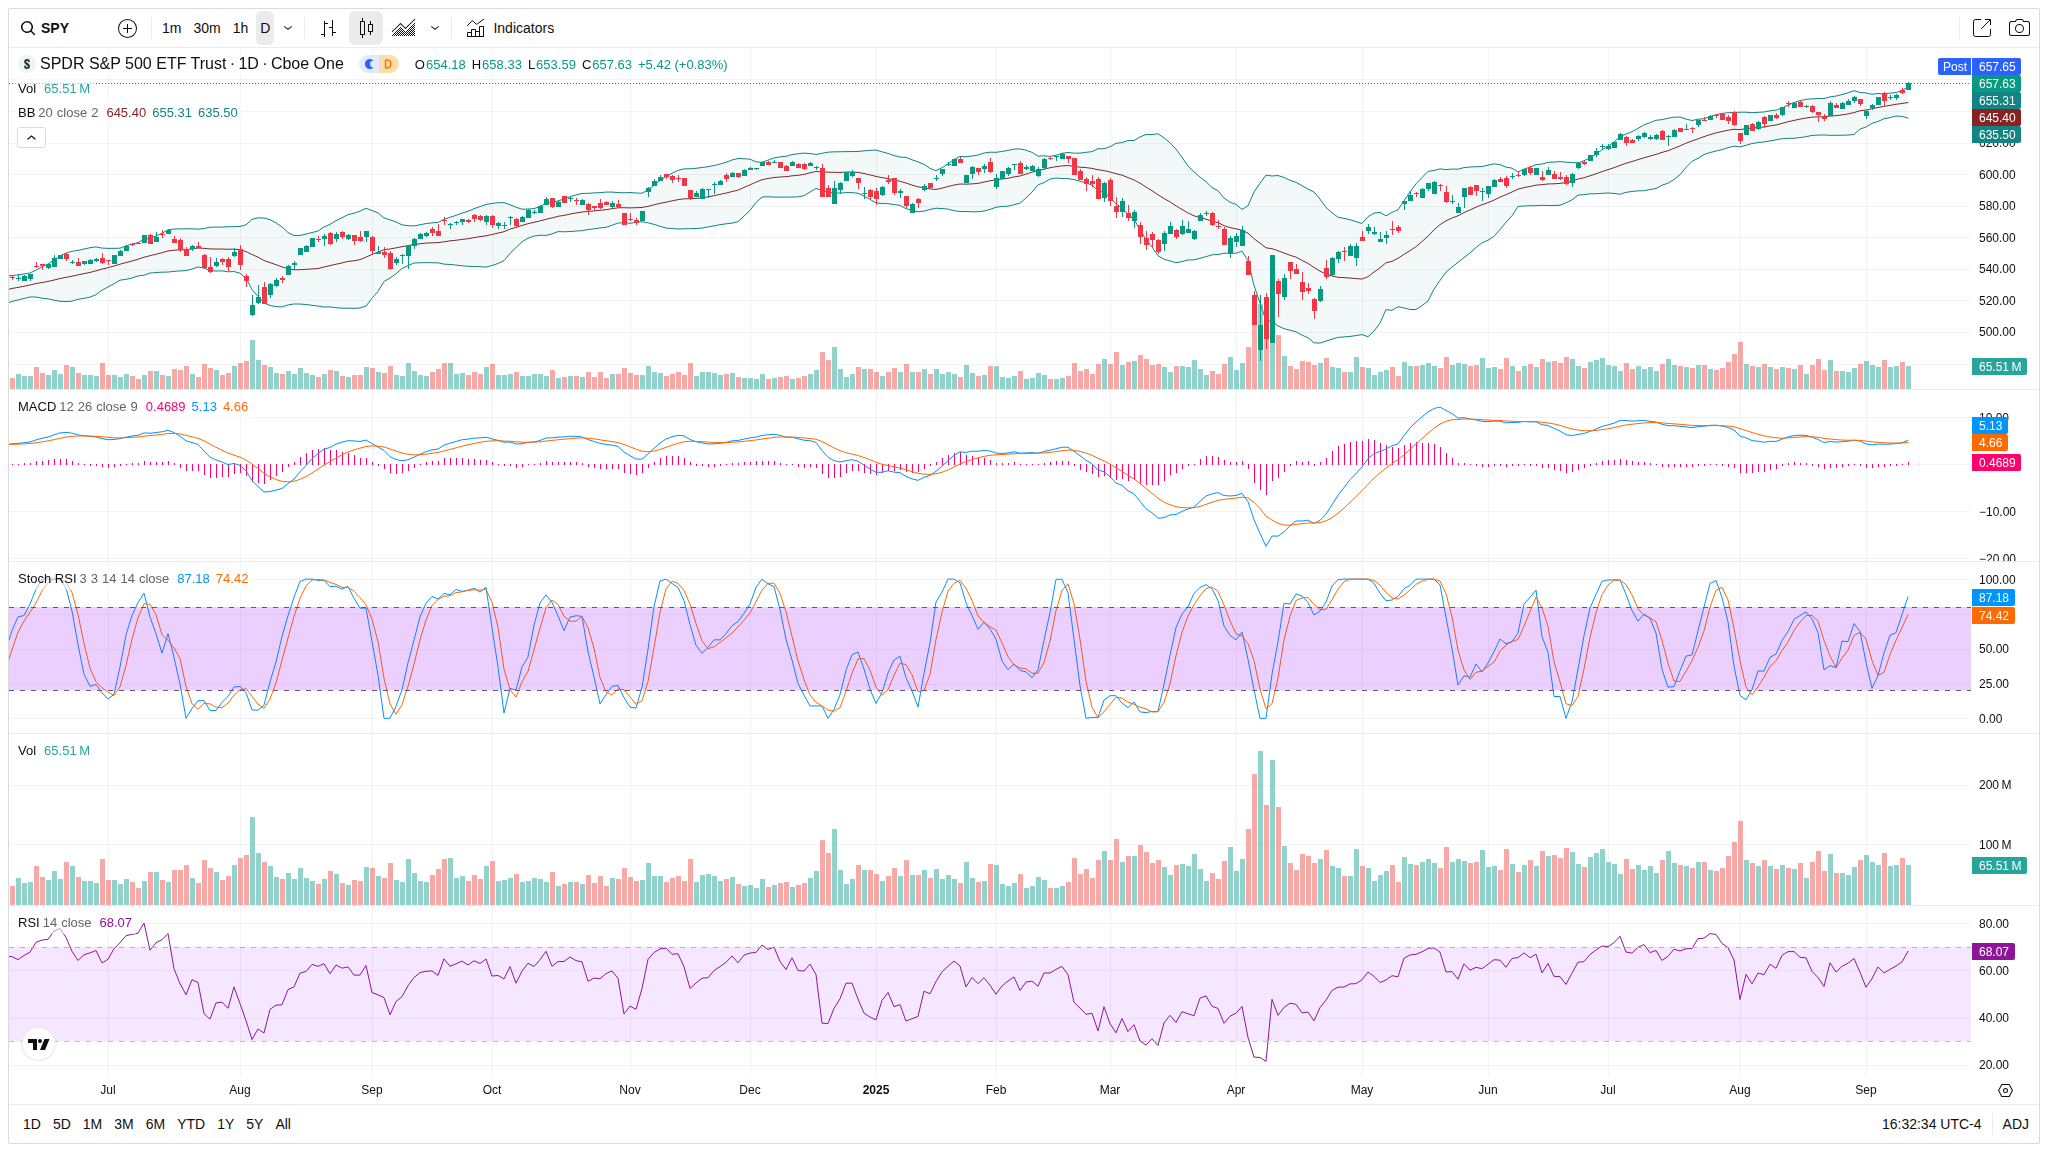
Daily Chart - SPY (1D)
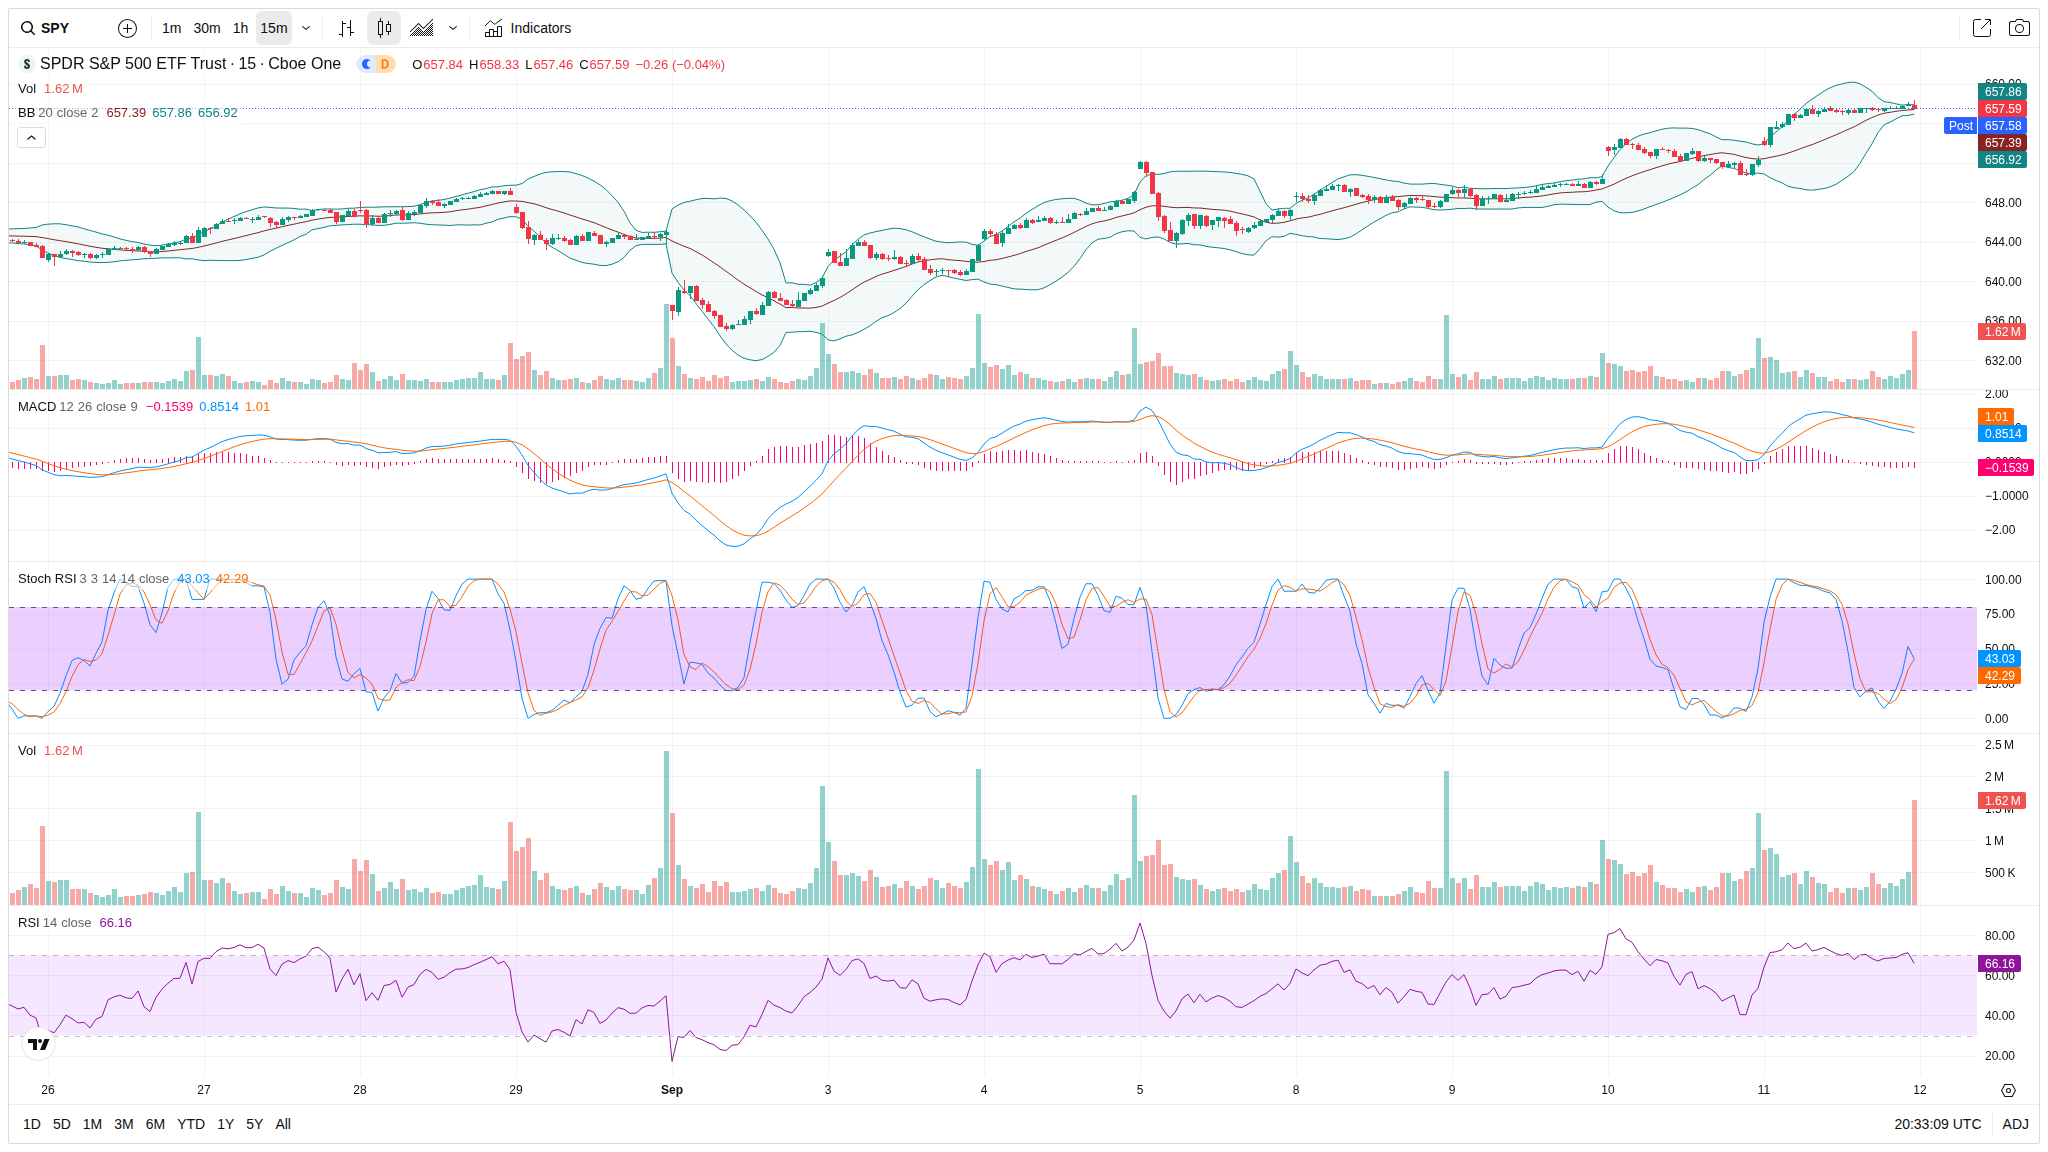
Intraday Chart - SPY (15 Min)
15-Minute Chart Analysis
Current Price:
657.59
Recent High/Low:
High 658.33, Low 657.58
Bollinger Bands:
- Upper Band: 657.39 - Middle (20 SMA): 657.86 - Lower Band: 656.92
Volume:
1.62M
Indicators:
- Stochastic (14, 1, 3): %K: 43.03 - MACD (12, 26, 9): -0.1539 - RSI (14): 66.16
Short-Term Support & Resistance:
- Support: 656.92 - Resistance: 658.33
Daily Chart Analysis
Current Price:
657.65
Bollinger Bands:
- Upper Band: 645.40 - Middle Band: 655.31 - Lower Band: 635.50
20-day SMA:
645.40
50-day SMA:
Information not provided
200-day SMA:
Information not provided
Indicators:
- MACD: 0.4689 - Stochastic Oscillator: %K = 87.18, %D = 74.42 - RSI (14): 68.07
Summary and Intraday Forecast
Bias:
Bullish
Likely Scenario by End of Trading Day:
The SPY is likely to experience a slight upward movement towards the upper resistance level, given the bullish indicators on both stochastic and MACD, supported by a positive RSI.
Key Levels to Watch:
- Immediate Support: 656.92 - Resistance: 658.33
×
Close