Key Indicators, Support & Resistance, and Daily Outlook
Daily Chart - SPY (1D)
Intraday Chart - SPY (15 Min)
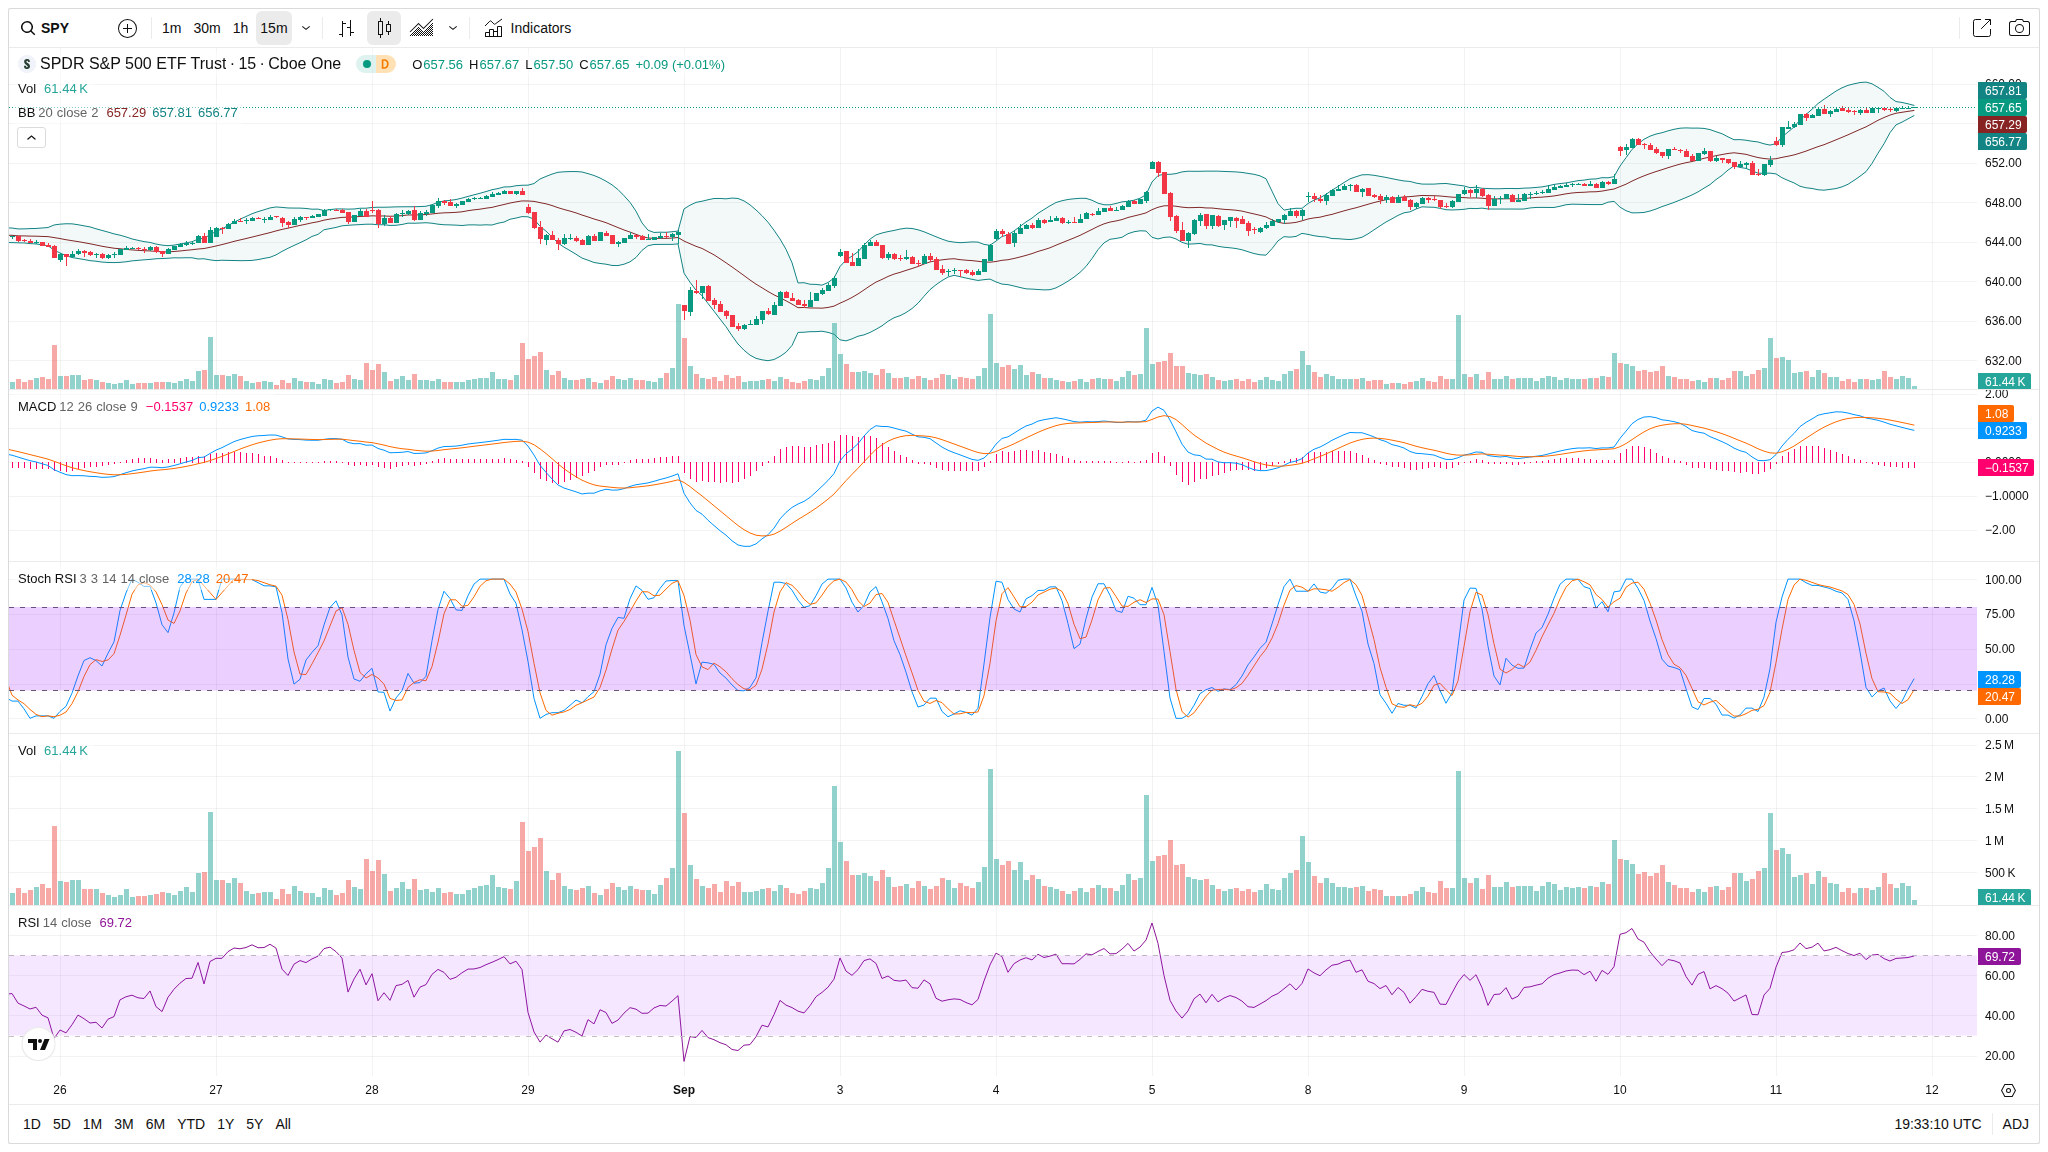
15-Minute Chart Analysis
Current Price: $657.65
Recent High/Low: High $657.67, Low $657.29
Bollinger Bands:
Upper Band: $657.81
Middle (20 SMA): $656.77
Lower Band: $655.77
Volume: 61.44K
Indicators:
Stochastic (14, 1, 3): %K : 28.28
MACD (12, 26, 9): -0.1537
RSI (14): 69.72
Short-Term Support & Resistance:
Support: $656.77
Resistance: $657.81
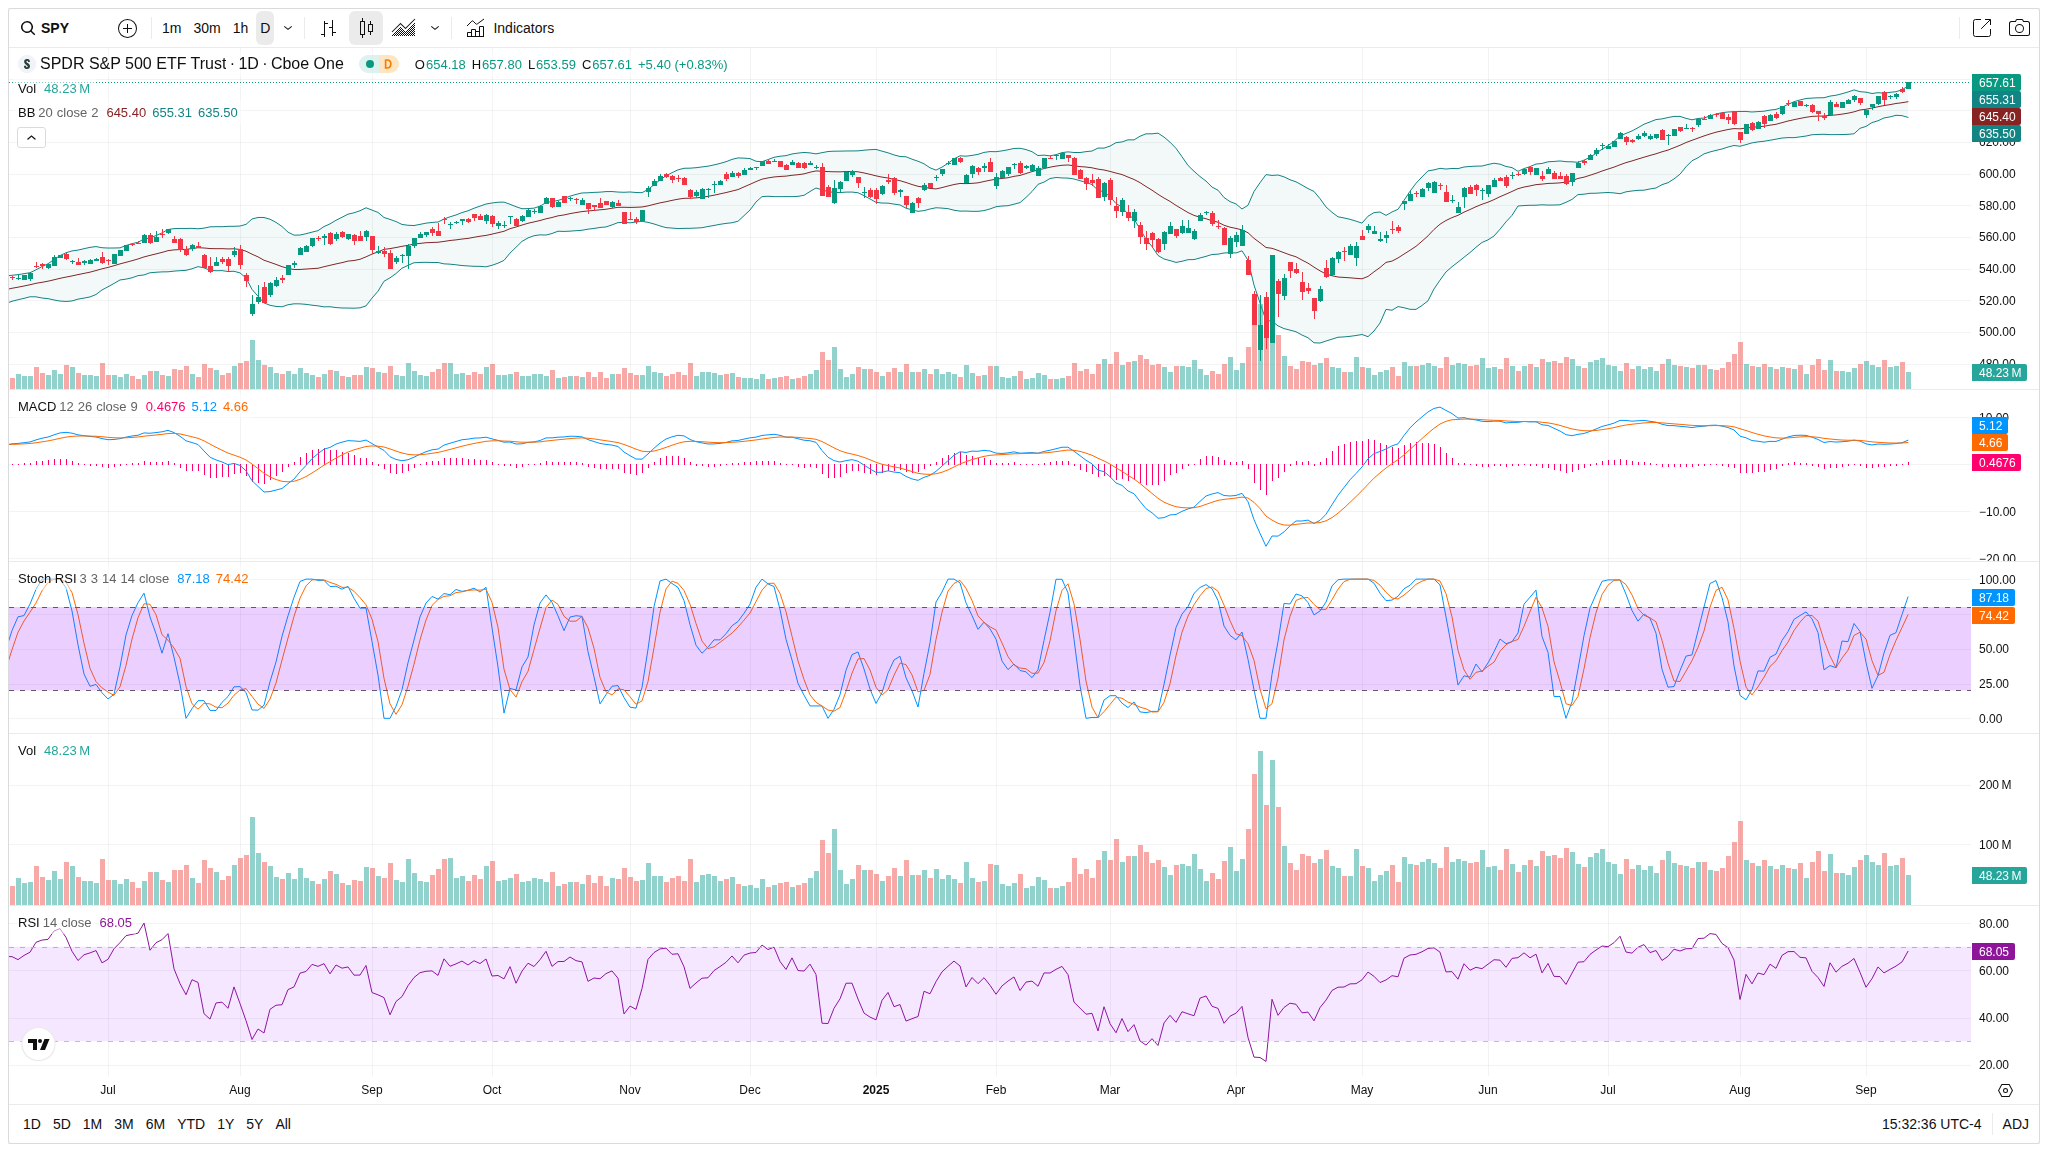
Daily Chart Analysis
Current Price: $657.61
Bollinger Bands:
Upper Band: $665.31
Middle Band: $655.31
Lower Band: $645.40
20-day SMA: $655.31
50-day SMA: Checking available data...
200-day SMA: Checking available data...
Indicators:
MACD: Positive
Stochastic Oscillator: %K = 87.18, %D = 74.42
RSI (14): 68.05
Summary and Intraday Forecast
Bias: Bullish
Likely Scenario by End of Trading Day: The indices are showing a slight bullish bias with the potential to break to new highs. Short-term indicators show room for upside movement.