Skip to content
Home
Market Analysis
Blog
Home
Market Analysis
Blog
SPY Technical Analysis - September 11, 2025
Key Indicators, Support & Resistance, and Daily Outlook
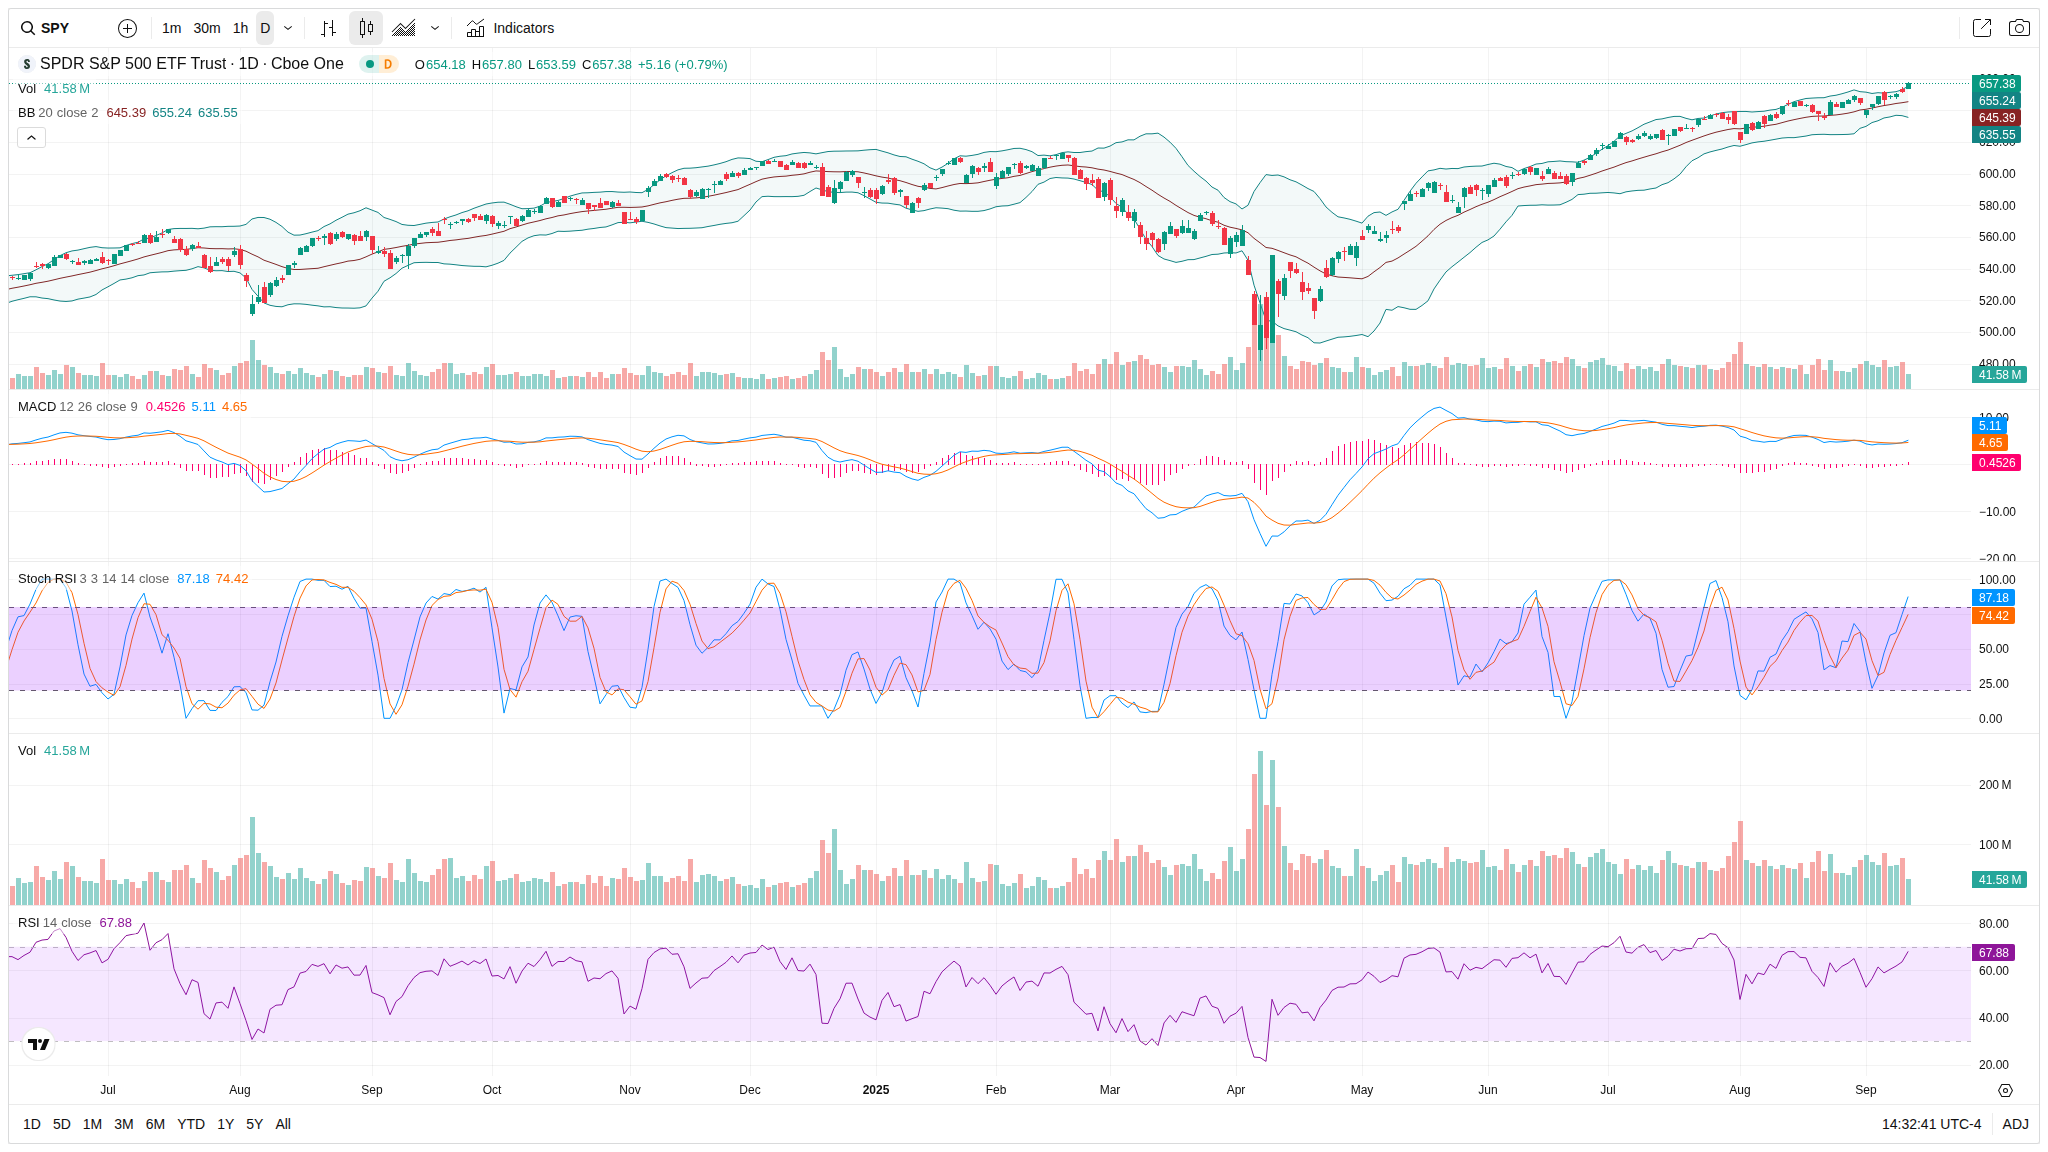
Daily Chart - SPY (1D)
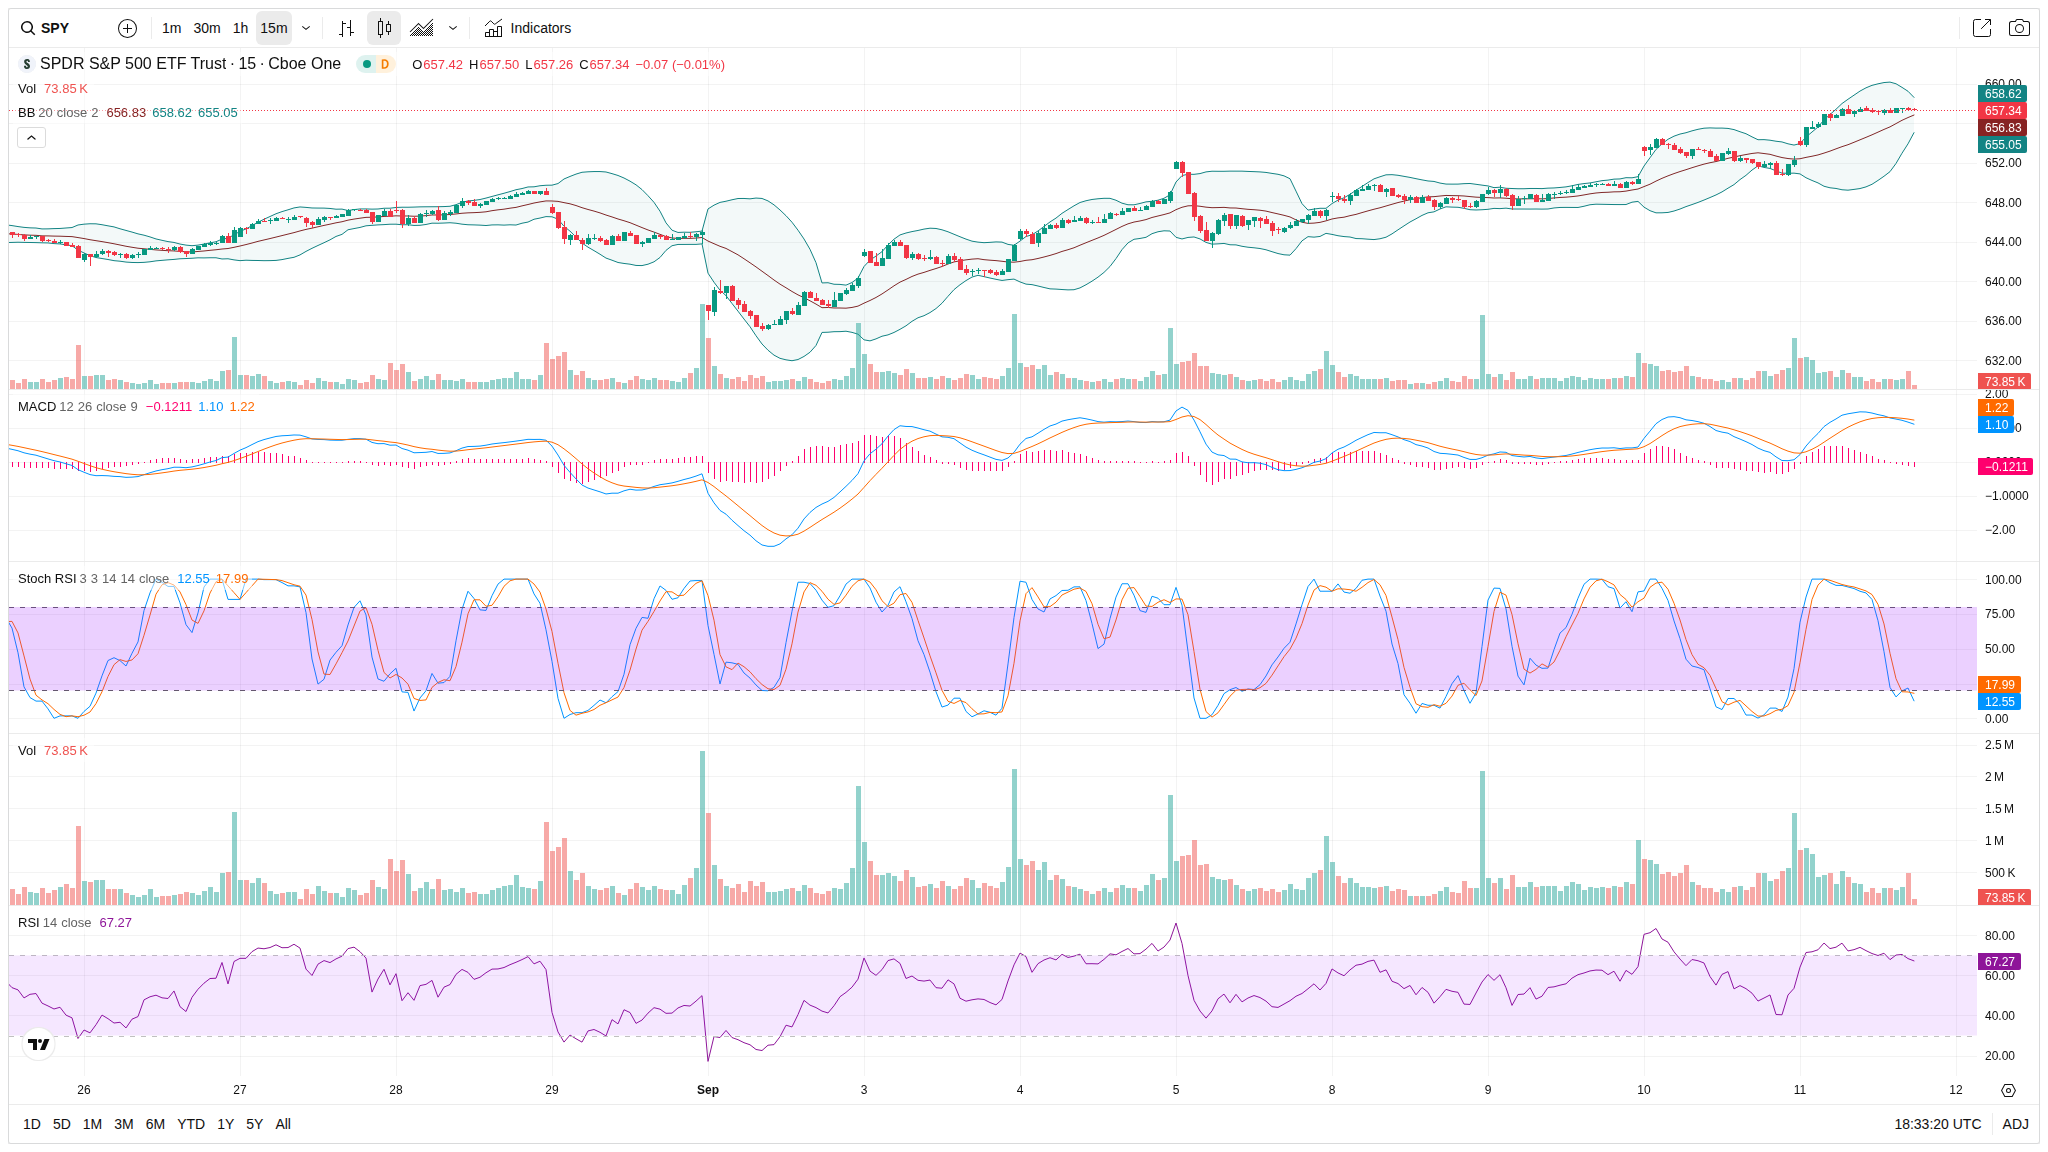
Intraday Chart - SPY (15 Min)
15-Minute Chart Analysis - Current Price: 657.34 - Recent High/Low: High 658.62, Low 656.28 - Bollinger Bands: - Upper Band: 658.62 - Middle (20 SMA): 656.83 - Lower Band: 655.05 - Volume: 73.85K - Indicators: - Stochastic (14, 1, 3): %K: 17.99 - MACD (12, 26, 9): -0.1211 - RSI (14): 67.27 - Short-Term Support & Resistance: - Support: 656.28 - Resistance: 658.62 Daily Chart Analysis - Current Price: 657.38 - Bollinger Bands: - Upper Band: 655.24 - Middle Band: 645.39 - Lower Band: 635.55 - 20-day SMA: --- - 50-day SMA: --- - 200-day SMA: --- - Indicators: - MACD: --- - Stochastic Oscillator: %K = 87.18, %D = 74.42 - RSI (14): 67.88 Summary and Intraday Forecast - Bias: Bullish with Caution - Likely Scenario by End of Trading Day: - The SPY is maintaining upward momentum but is currently facing resistance at the upper Bollinger Band in the 15-minute chart. The slight decrease in MACD may suggest a potential consolidation or minor pullback before any further upmove. Continued monitoring is needed around 658.62 resistance level. Key Levels to Watch: - Immediate support: 656.28 - Resistance: 658.62
×
Close