Key Indicators, Support & Resistance, and Daily Outlook
Daily Chart - SPY (1D)
Intraday Chart - SPY (15 Min)
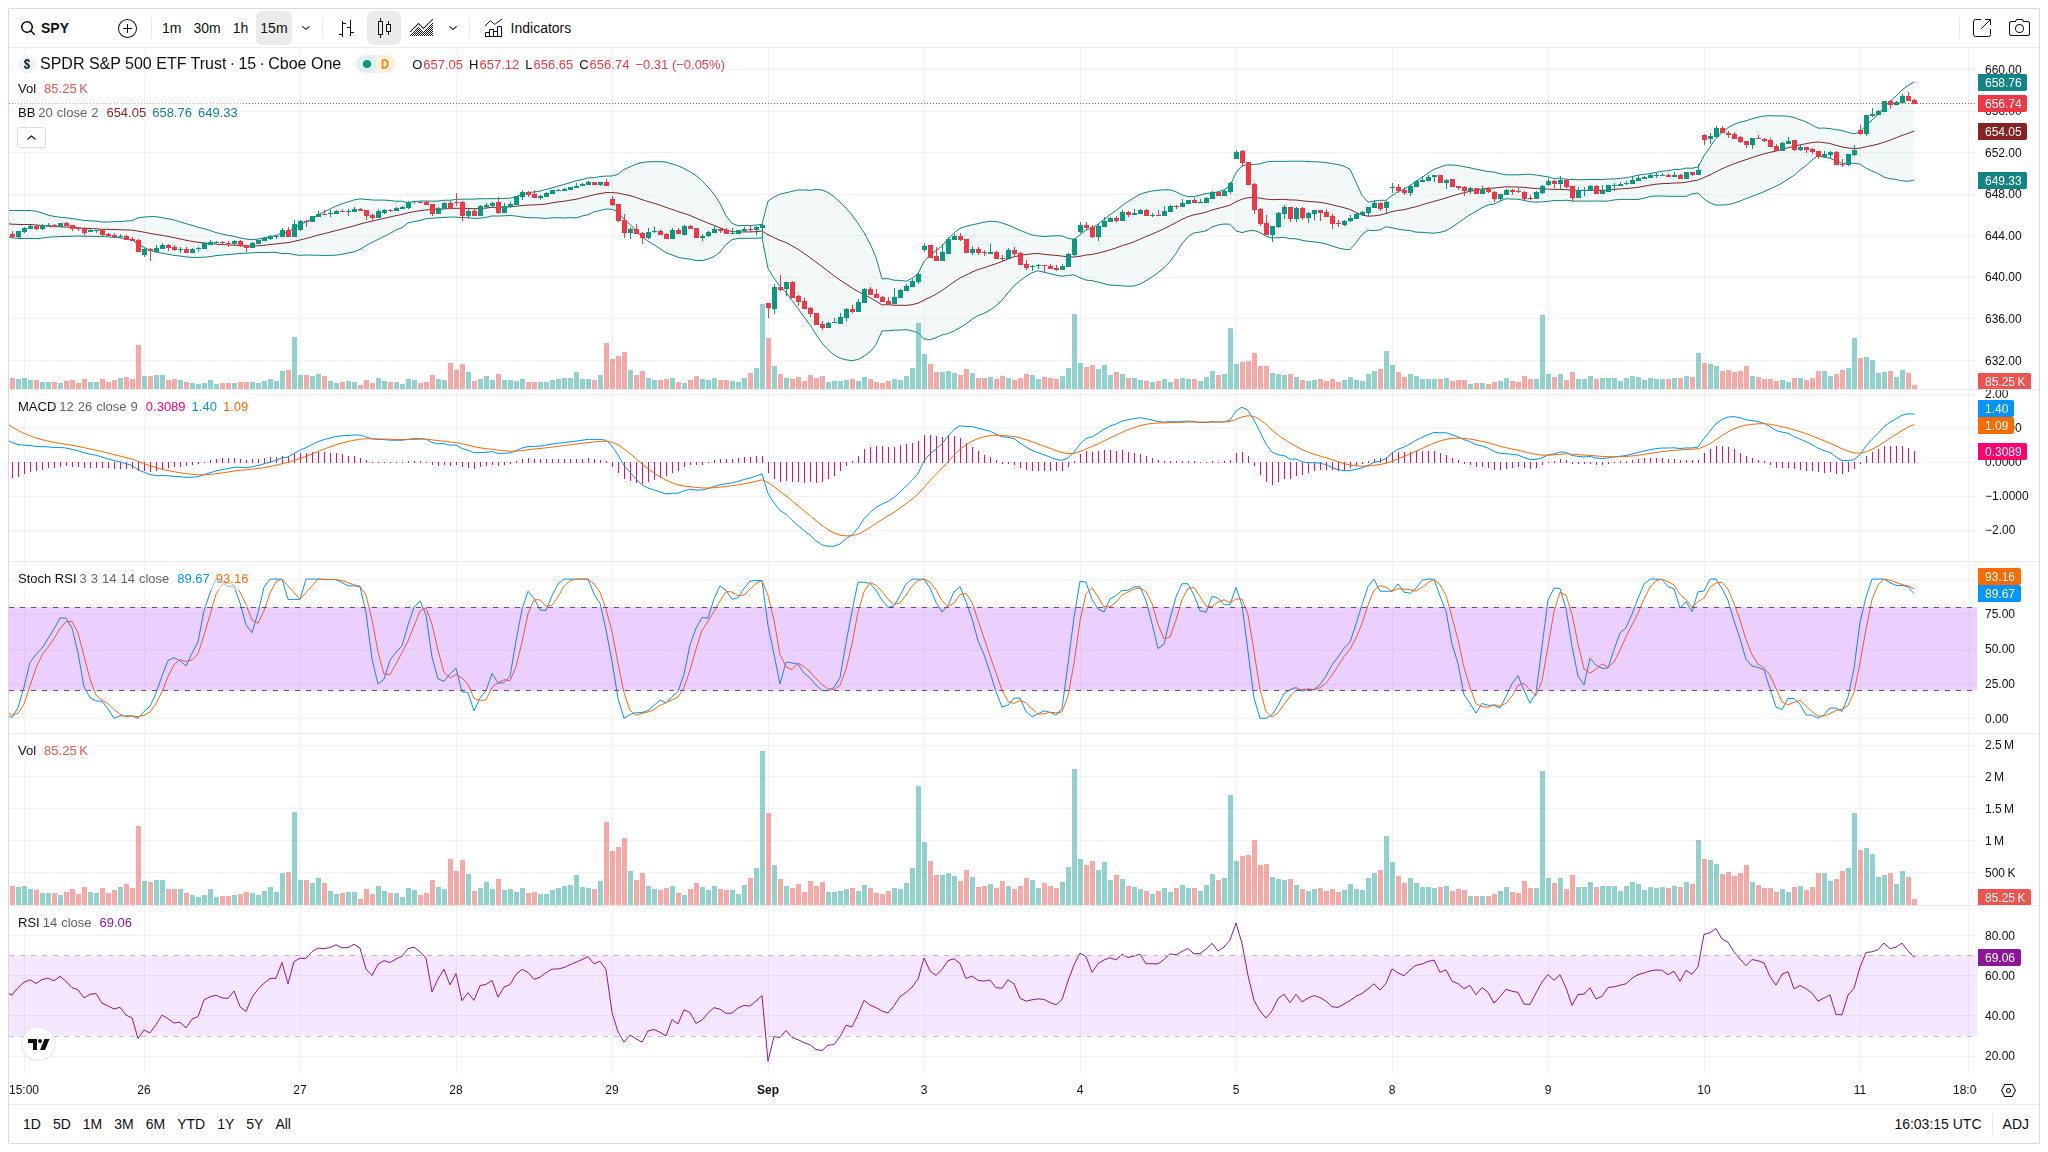
15-Minute Chart Analysis
Current Price: 656.74
Recent High/Low: High 657.12, Low 656.00
Bollinger Bands:
Upper Band: 658.76
Middle (20 SMA): 654.05
Lower Band: 649.33
Volume: 85.25K
Indicators:
Stochastic (14, 1, 3): %K : 89.67
MACD (12, 26, 9): 1.40
RSI (14): 69.06
Short-Term Support & Resistance:
Support: 650.00
Resistance: 658.00
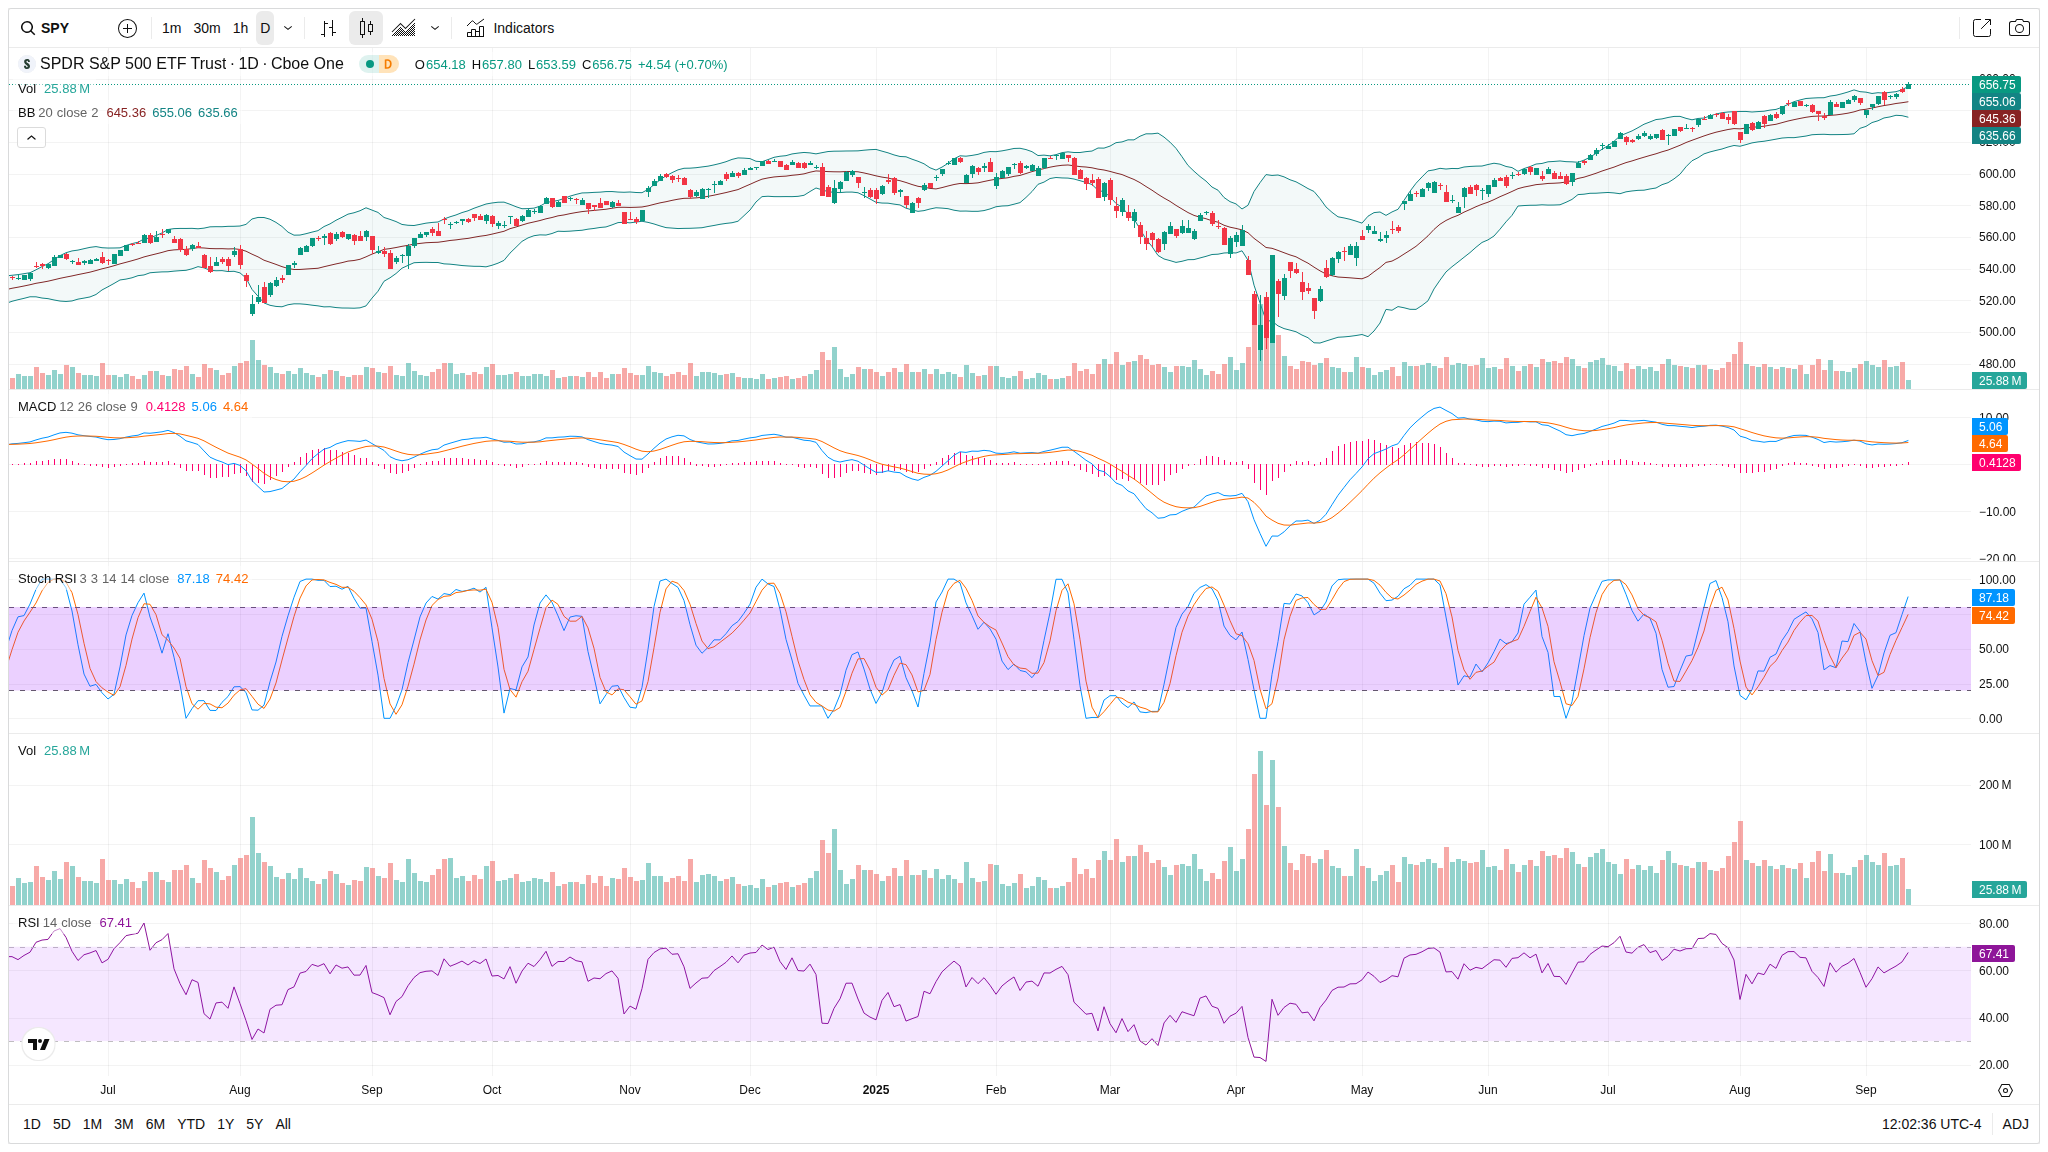
Daily Chart Analysis
Current Price: 656.75
Bollinger Bands:
Upper Band: 655.06
Middle Band: 645.36
Lower Band: 635.66
20-day SMA: 645.36
50-day SMA: 640.00
200-day SMA: 630.00
Indicators:
MACD: 4.64
Stochastic Oscillator: %K = 87.18, %D = 74.42
RSI (14): 67.41
Summary and Intraday Forecast
Bias: Bullish
Likely Scenario by End of Trading Day: With the current bullish momentum and strong indicators, it is likely the SPY will attempt to breach the resistance level of 658.00. The overbought RSI may suggest caution, but upward pressure seems strong.