Key Indicators, Support & Resistance, and Daily Outlook
Daily Chart - SPY (1D)
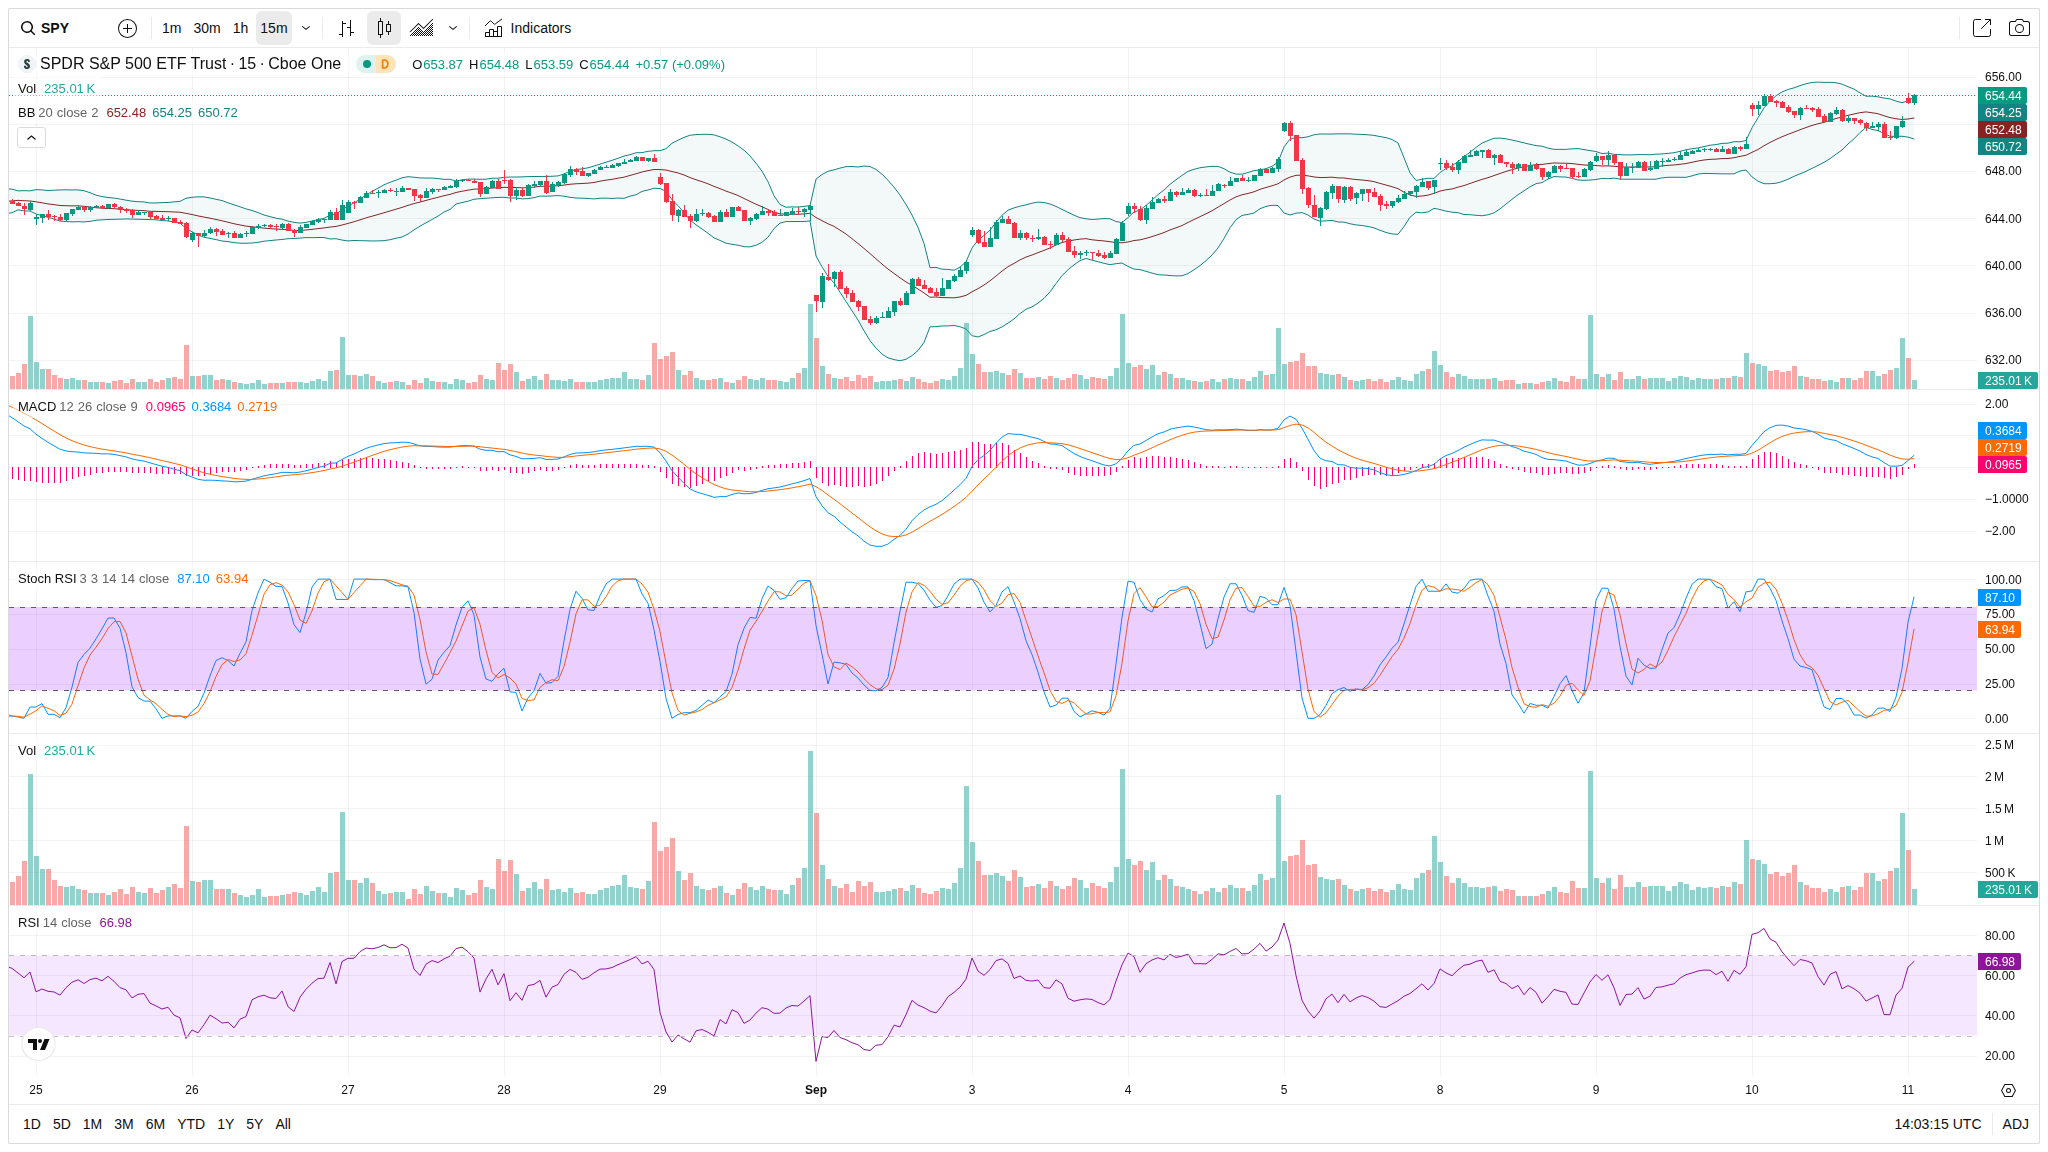
Intraday Chart - SPY (15 Min)
15-Minute Chart Analysis
Current Price: 654.44
Recent High/Low: High 655.44, Low 650.72
Bollinger Bands:
Upper Band: 654.25
Middle (20 SMA): 652.48
Lower Band: 650.72
Volume: 235.01K
Indicators:
Stochastic (14, 1, 3): %K : 87.10
MACD (12, 26, 9): 0.0965
RSI (14): 66.98
Short-Term Support & Resistance:
Support: 650.72
Resistance: 655.44
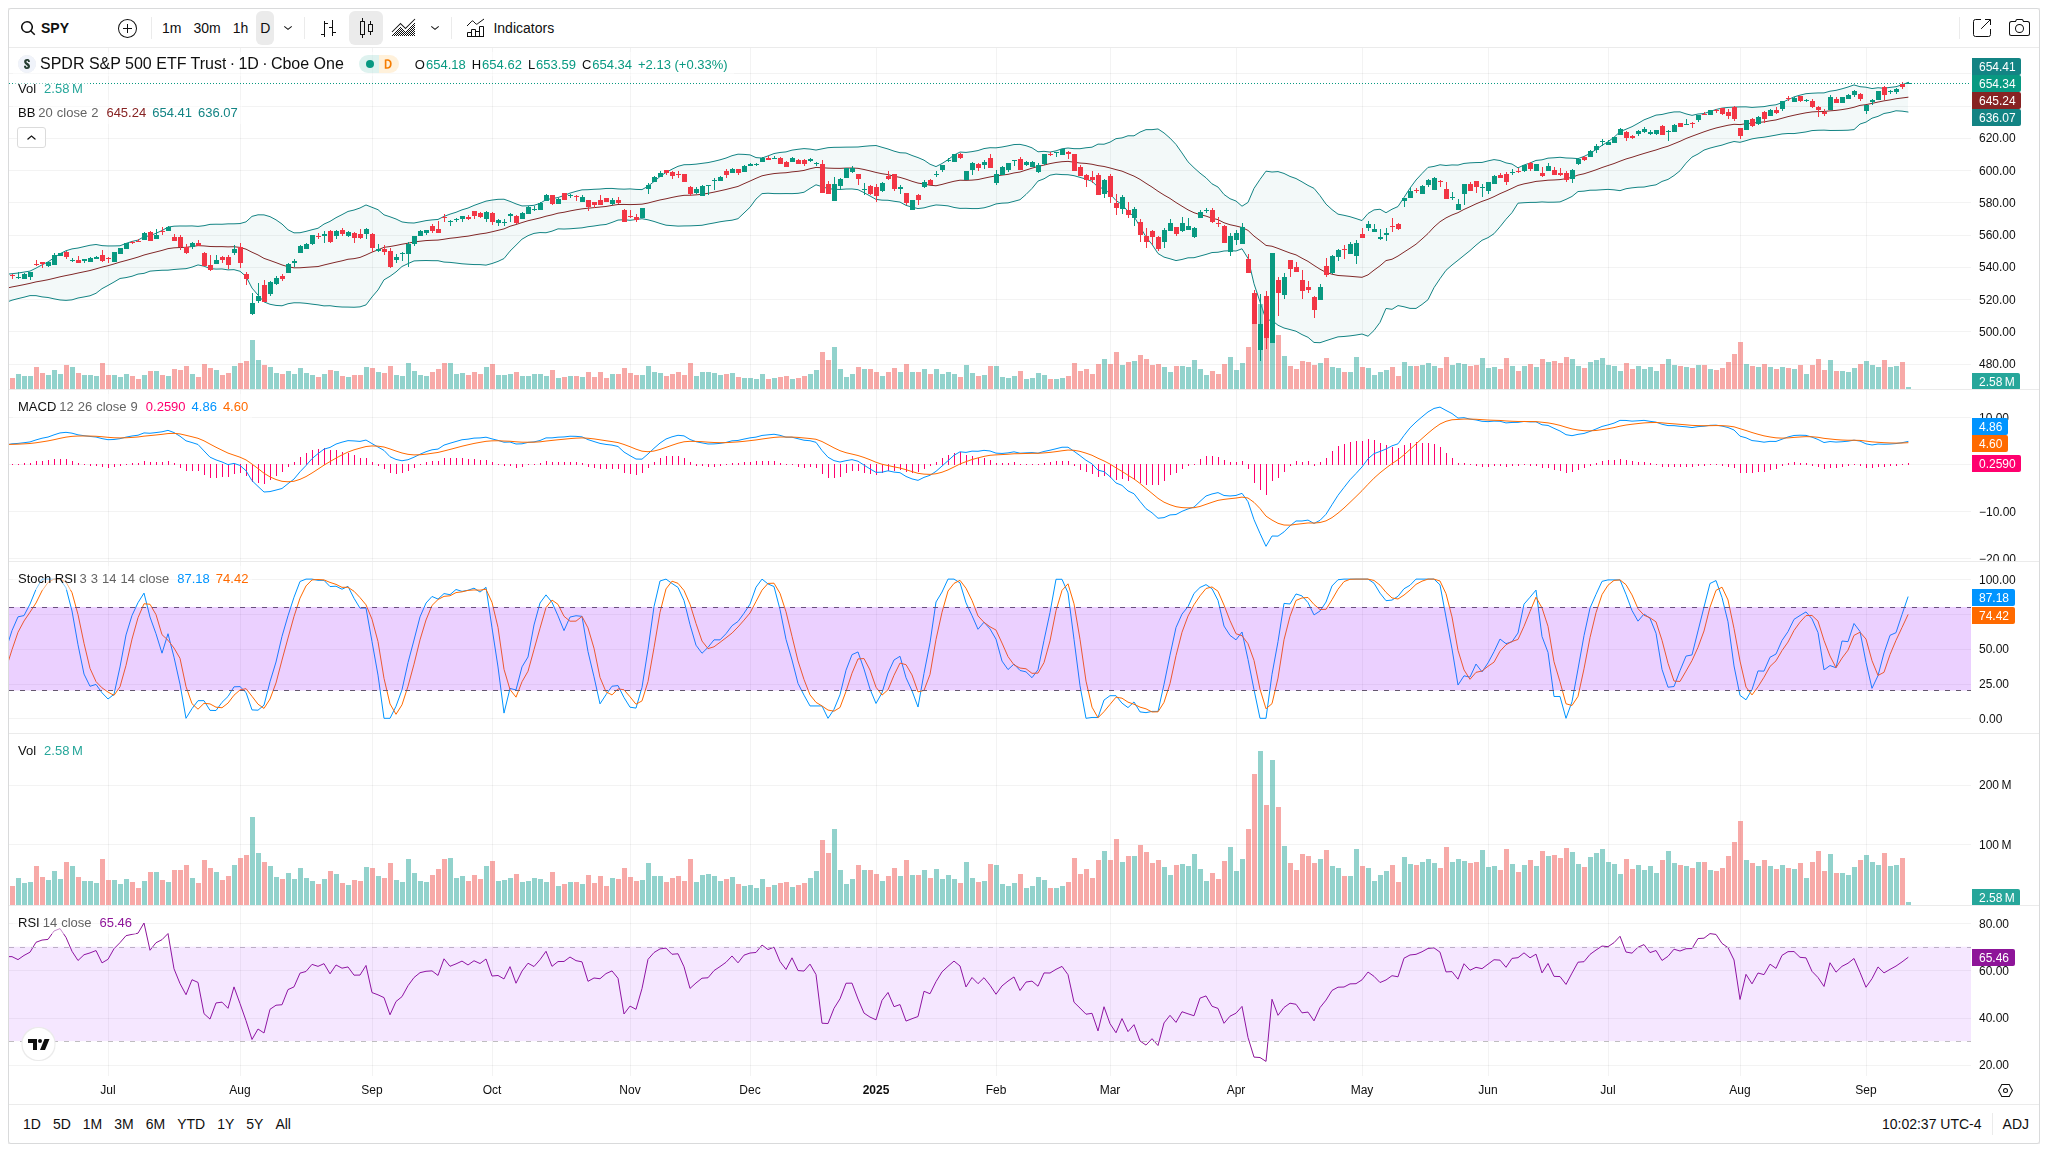
Daily Chart Analysis
Current Price: 654.34
Bollinger Bands:
Upper Band: 654.41
Middle Band: 645.24
Lower Band: 636.07
20-day SMA: 645.24
50-day SMA: 636.07
200-day SMA: Not shown
Indicators:
MACD: 0.2590
Stochastic Oscillator: %K = 87.18, %D = 74.42
RSI (14): 65.46
Summary and Intraday Forecast
Bias: Bullish
Likely Scenario by End of Trading Day: The SPY shows strong support at the middle band of the Bollinger Bands and bullish indicators such as a high RSI and Stochastic showing overbought conditions suggest further upward momentum could continue. Expect moderate gains if the current trend holds.