SPY Technical Analysis - August 6, 2025
Key Indicators, Support & Resistance, and Daily Outlook
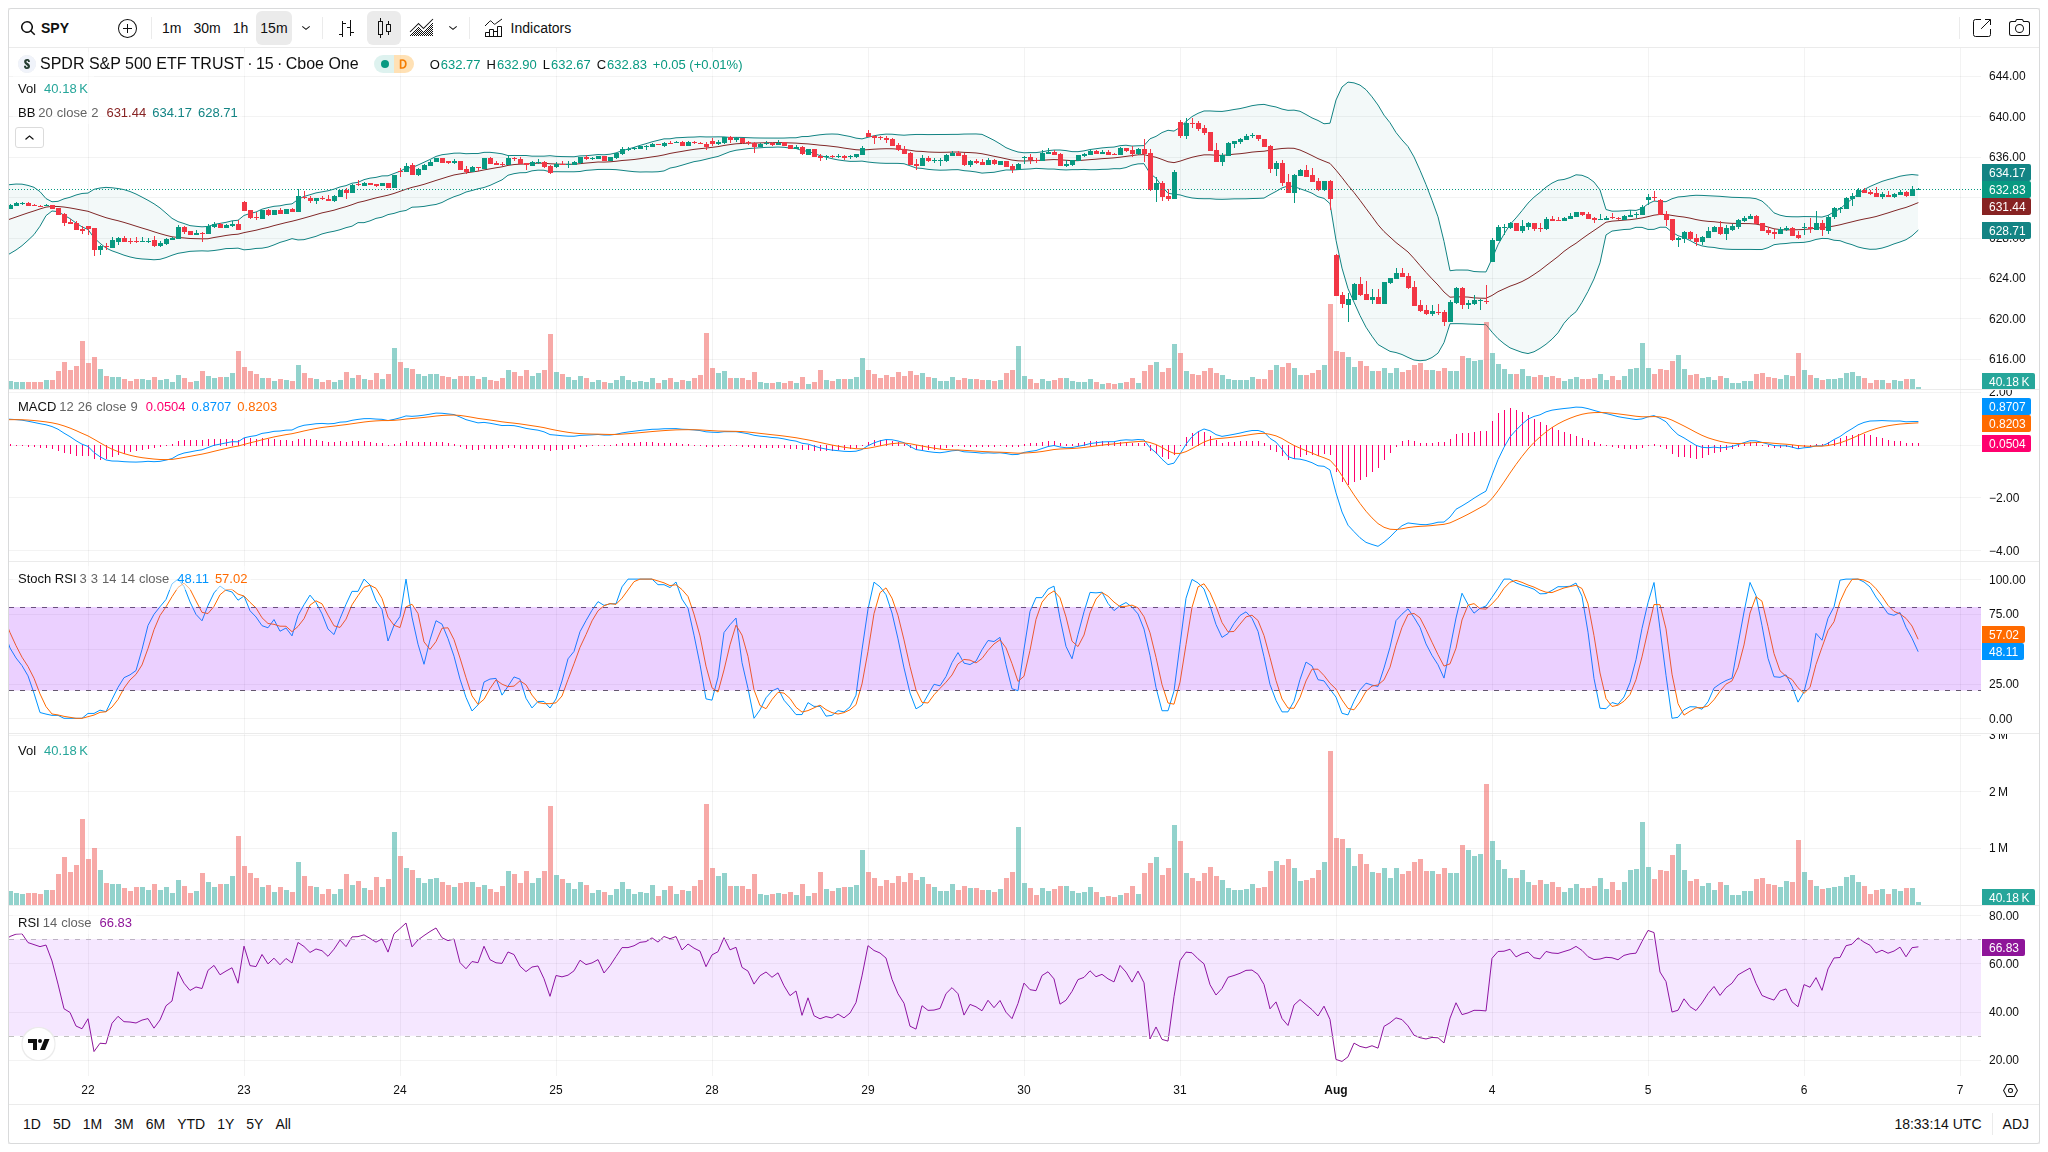
15-Minute Chart Analysis
Current Price: 632.83
Recent High/Low: High 634.17, Low 628.71
Bollinger Bands:
- Upper Band: 634.17
- Middle (20 SMA): 631.44
- Lower Band: 628.71
Volume: 40.18K
Indicators:
- Stochastic (14, 1, 3): %K : 48.11
- MACD (12, 26, 9): 0.05
- RSI (14): 66.83
Short-Term Support & Resistance:
- Support: 628.71
- Resistance: 634.17
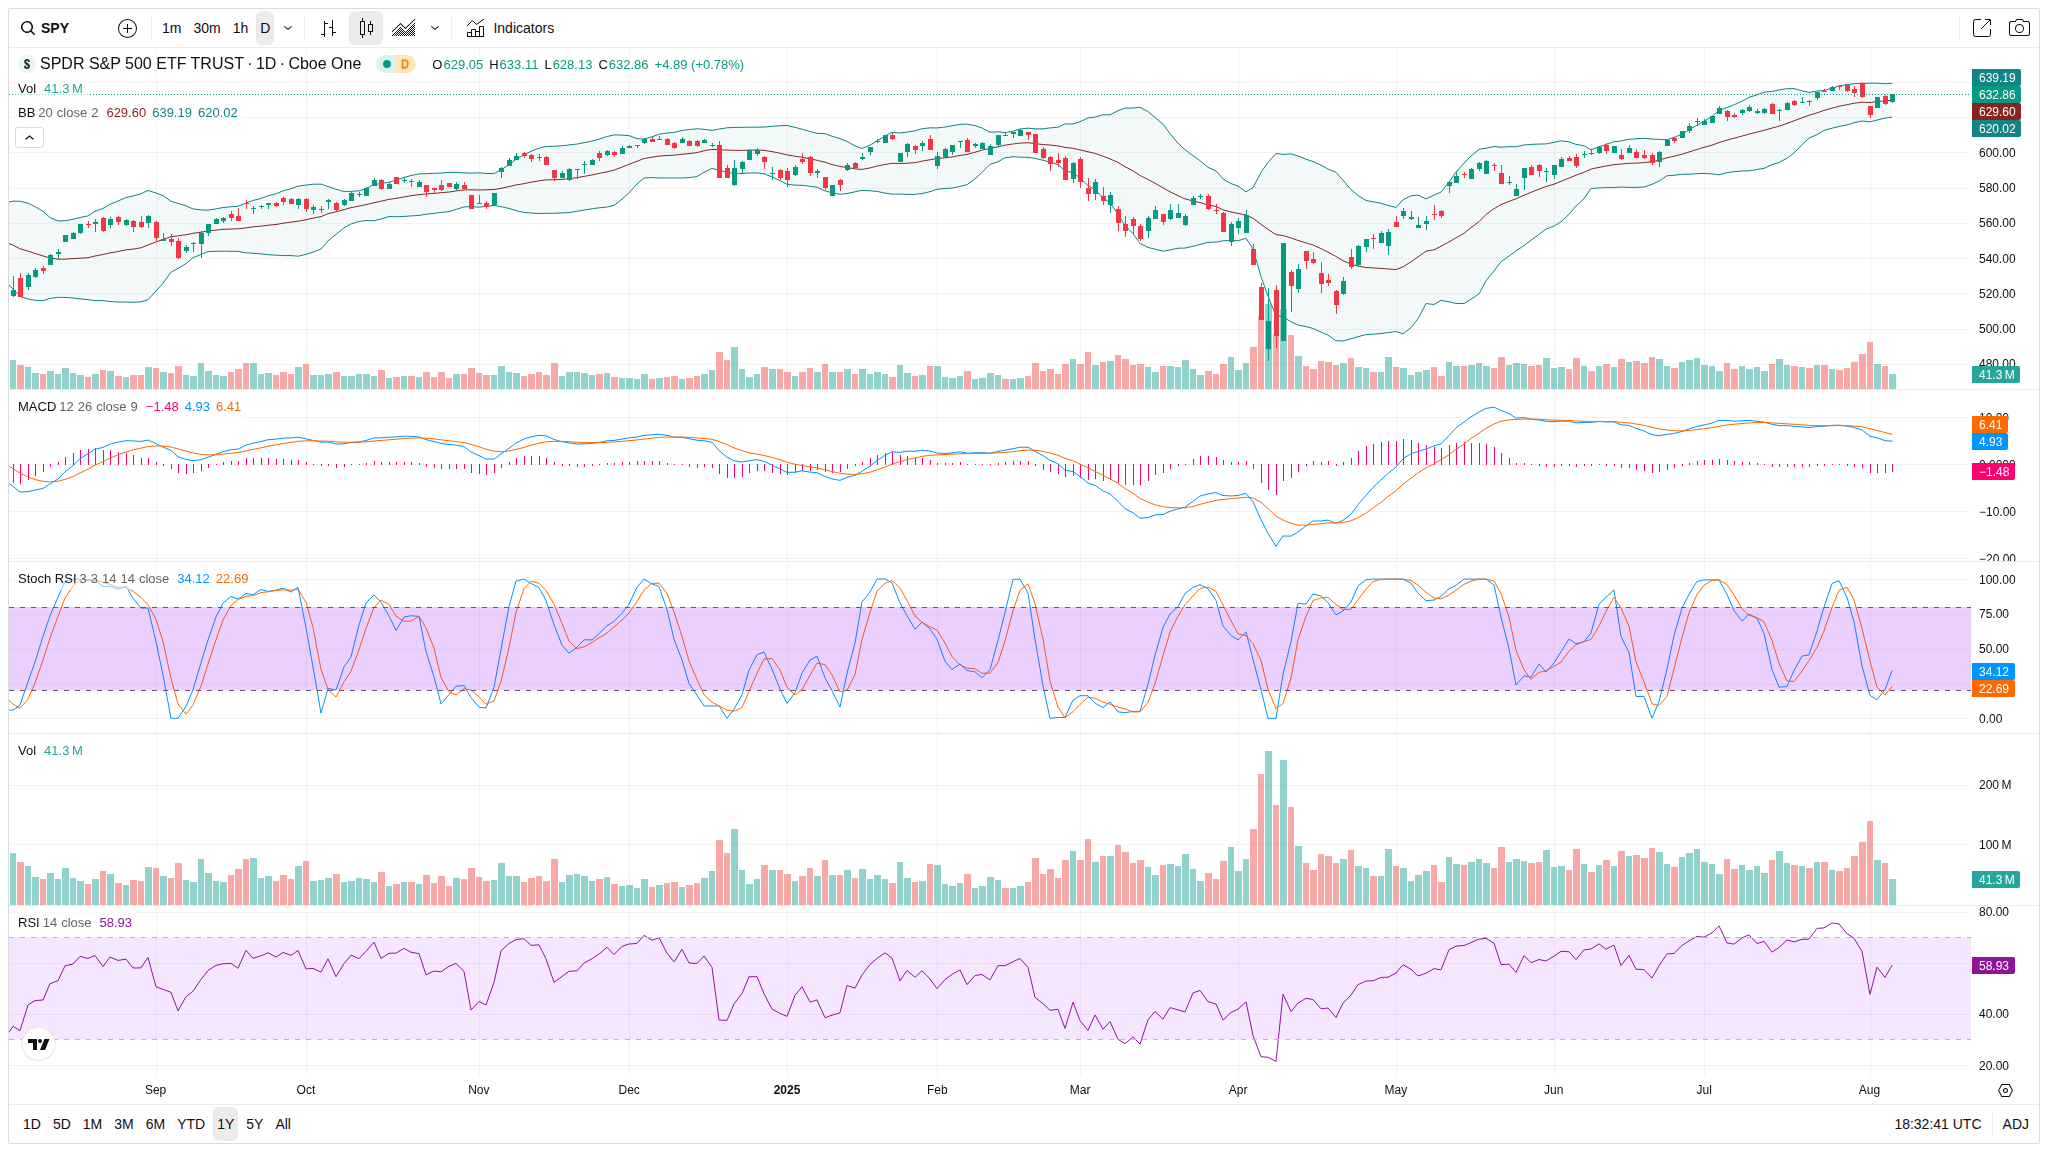
Daily Chart Analysis
Current Price: 632.83
Bollinger Bands:
- Upper Band: 639.19
- Middle Band: 629.60
- Lower Band: 620.02
- 20-day SMA: 629.60
- 50-day SMA: (approximately can be assumed from trend)
- 200-day SMA: (approximately can be assumed from trend)
Indicators:
- MACD: 4.93
- Stochastic Oscillator: %K = 34.12, %D = 22.69
- RSI (14): 58.93
Summary and Intraday Forecast
Bias: Neutral to Slightly Bullish
Likely Scenario by End of Trading Day: The SPY is likely to remain within the current support and resistance levels. A close within this range would suggest consolidation, but breaking either support or resistance could indicate further directional movement.
Key Levels to Watch:
- Immediate Support: 628.71
- Resistance: 634.17


