Trend: The daily chart is showing an upward trend with the price moving along the upper Bollinger Band.
Volume: The volume is relatively steady, indicating consistent trading activity.
MACD: The MACD is slightly above its signal line, suggesting bullish momentum.
RSI: The RSI is at 73.60, indicating an overbought condition.
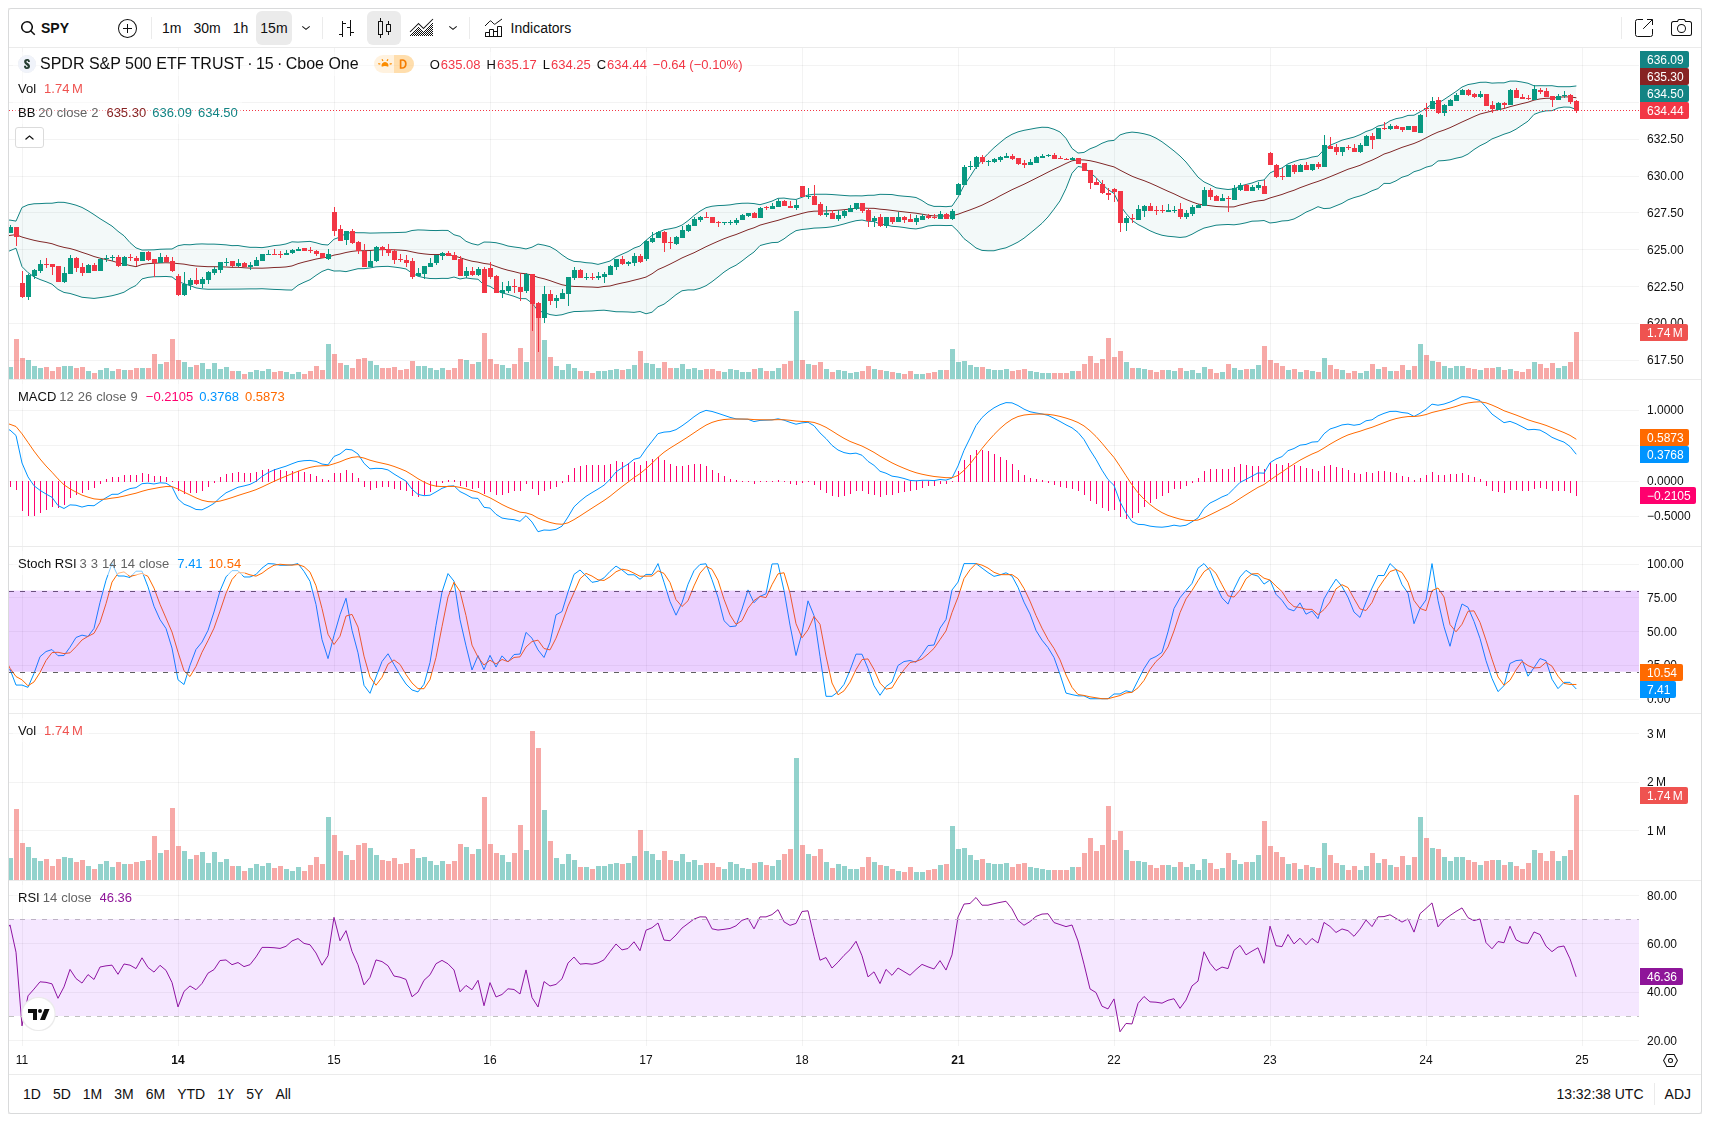
15-Minute Chart Overview
Trend: The 15-minute chart shows a recent downturn with the price falling below the middle Bollinger Band.
Volume: A slight increase in volume is observed, potentially signaling increased interest or volatility.
MACD: The MACD is below the signal line, indicating short-term bearish pressure.
RSI: The RSI is at 46.36, showing neutrality with a slight bearish lean.
Market Momentum and Prediction
Momentum: The market has shown mixed signals, with the daily chart suggesting strength while the 15-minute chart indicates potential short-term weakness.
Prediction: Given the overbought condition on the daily chart and short-term bearish signals, a pullback might occur.
End-of-Day Projection
Projection: By the end of the day, the S&P 500 may experience slight downward pressure, potentially closing slightly lower than the current levels. However, given the overall bullish trend on the daily chart, significant declines are less likely.