Skip to content
Home
Market Analysis
About us
Blog
Home
Market Analysis
About us
Blog
S&P 500 Technical Analysis 2025-07-25 09:20:56
S & P 500 Index - 1D TVC
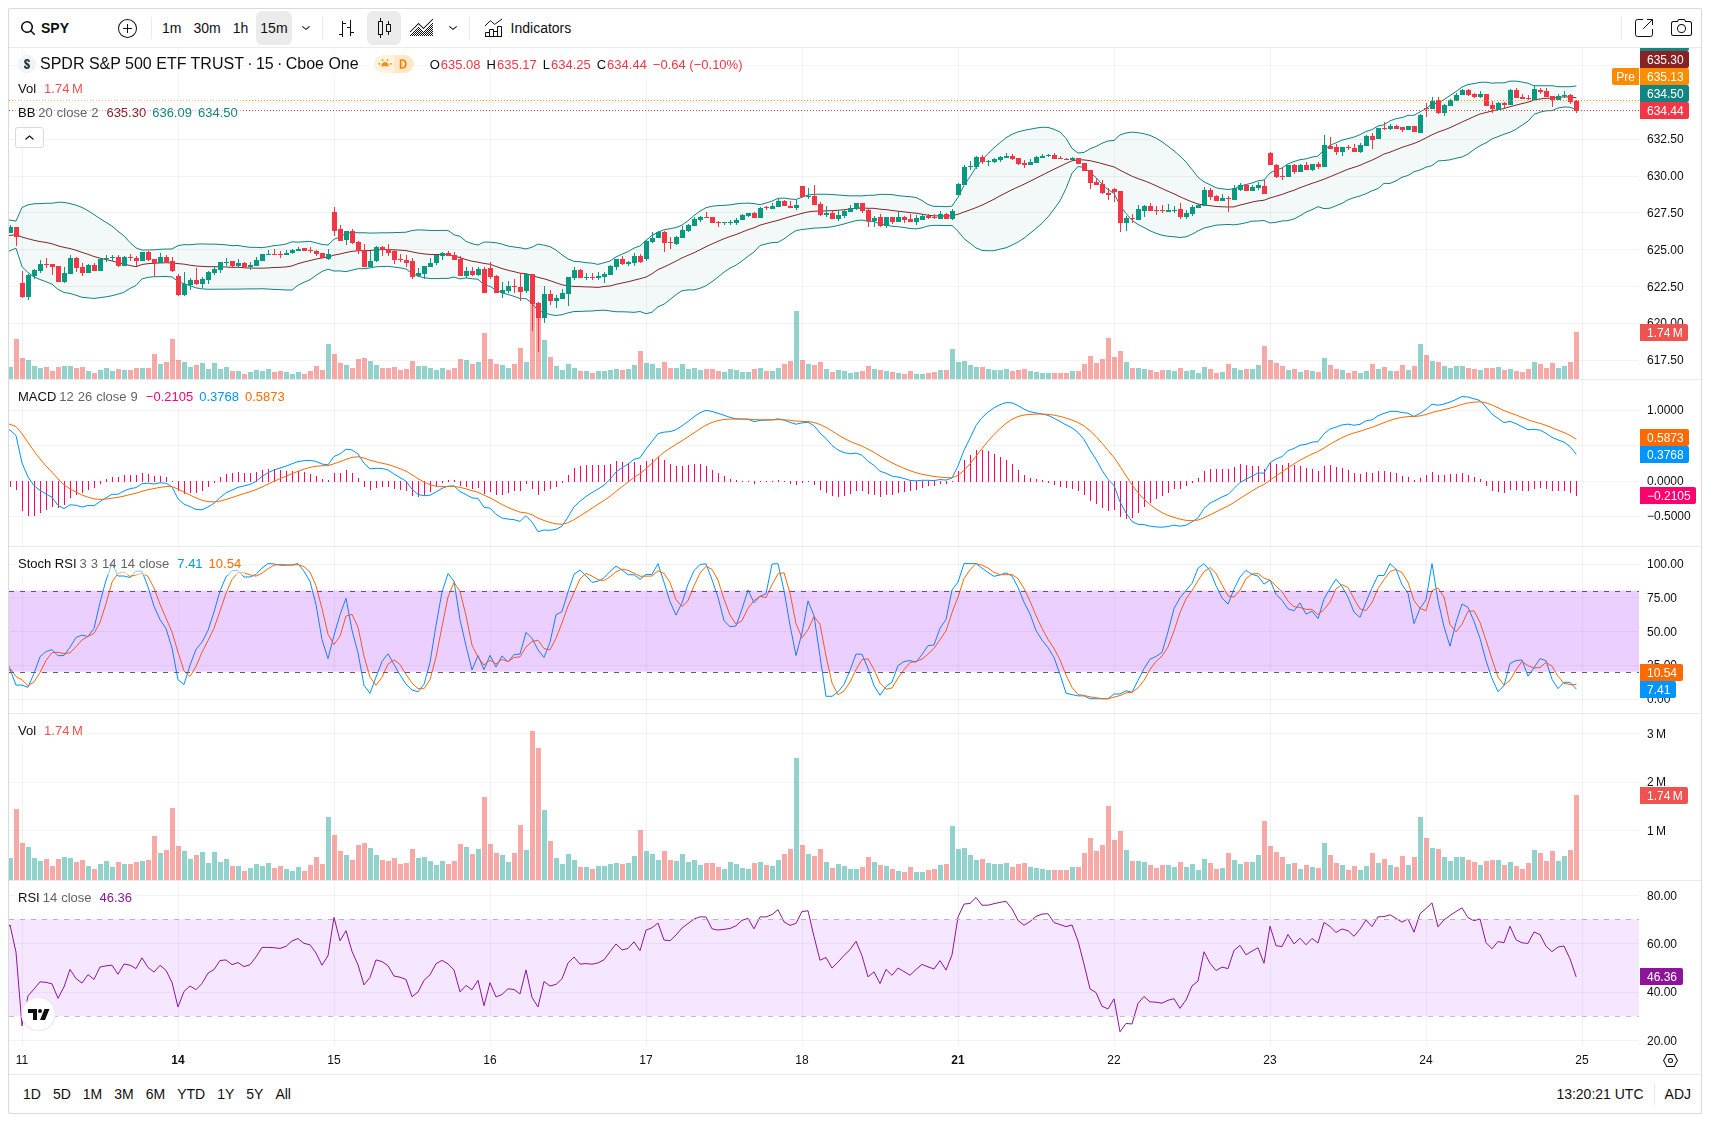
S & P 500 Index - 15 Min TVC
Daily Technical Analysis – S&P 500
Daily Technical Analysis – S&P 500
Date: 25.07.2025
Time: 09:20:22
Daily Chart Overview
Trend:
The daily chart shows an upward trend, slightly tapering off, indicating potential consolidation.
Volume:
The average daily volume suggests stability but might lack enough momentum for a strong breakout.
Indicators:
Bollinger Bands suggest the price is near the upper band, implying overbought conditions.
MACD is slightly positive, indicating a weakening bullish momentum.
Stochastic RSI is above 70, indicating overbought conditions.
RSI is around 73, supporting overbought conditions.
15-Minute Chart Overview
Trend:
The 15-minute chart indicates a short-term downtrend, with slight corrections.
Volume:
A spike in volume has been observed in recent sessions, suggesting upcoming volatility.
Indicators:
Bollinger Bands show prices at the lower band, suggesting oversold conditions.
MACD is negative and below the signal line, confirming bearish momentum.
Stochastic RSI is around 10, indicating oversold conditions.
RSI is at 46, suggesting the potential for reversal.
Market Momentum and Prediction
The market exhibits mixed signals with a short-term bearish and medium-term bullish trend.
Short-term corrections may continue, but the daily trend suggests possible recovery.
End-of-Day Projection
With 6.66 hours left in the trading day, expect potential recovery towards the upper Bollinger Band.
Volatility may increase, as depicted by volume fluctuations and oversold conditions on the 15-minute chart.
The expected end-of-day closing range is likely between the current price and the upper Bollinger Band limit.
×
Close